EPISODE #012 — How Does Labor Utilization Evolve Over Time?
In EPISODE #011, we examined labor utilization as a snapshot.
That snapshot showed where G7 economies were positioned in participation–unemployment space. But a snapshot alone does not show whether these positions are stable, temporary, or changing over time.
A natural next question follows:
How does labor utilization evolve over time?
1. From Position to Trajectory
Labor utilization is not a fixed condition. It changes as labor force participation and unemployment change.
As in the previous episode, labor utilization is measured here by the employed population ratio:
Employed population ratio = LFPR × (1 − Unemployment Rate)
This identity allows us to move from a static comparison to a dynamic one. Instead of asking where economies are located at a single point in time, we now ask how their positions evolve across time.
A snapshot shows position.
A time series shows trajectory.
2. Labor Utilization Over Time (G7, 1991–2024)
The figure below traces the employed population ratio in the G7 from 1991 to 2024.
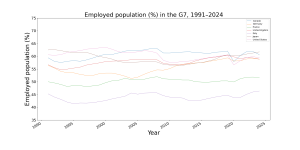
Figure 12-1. Employed population (%) in the G7, 1991–2024.
Source: World Bank, World Development Indicators (SL.TLF.CACT.ZS; SL.UEM.TOTL.ZS).
Labor utilization levels across G7 countries show some narrowing over time, but substantial differences persist, with France and Italy remaining consistently below the others.
The figure therefore suggests only limited convergence. While several countries move toward a narrower range, labor utilization paths remain distinct, and country rankings are far from fully erased.
Japan remains at the upper end throughout most of the period, while Italy remains persistently low. Germany and the United Kingdom improve over time, whereas the United States experiences a visible decline after the late 2000s and only partial recovery thereafter.
3. Divergent Trajectories
Although the dispersion in labor utilization narrows somewhat, the time paths differ considerably across economies.
Japan begins from a high level, declines through the 1990s and 2000s, and later recovers toward its earlier position. Canada rises strongly into the 2000s, then settles at a somewhat lower plateau. Germany shows a delayed but clear improvement, especially after the late 2000s. The United Kingdom improves more gradually and then stabilizes.
By contrast, France remains broadly stable at a lower level, and Italy remains persistently weak throughout the period. The United States occupies a relatively high position in the early years, but later experiences a decline driven by weaker labor utilization than in the late 1990s and early 2000s.
These trajectories indicate that labor utilization does not evolve along a common path across advanced economies. Structural differences remain visible even when broad clustering appears stronger than in the early 1990s.
4. Participation and Absorption
Changes in labor utilization arise through two channels:
- Participation — how many people enter the labor force
- Absorption — how many participants actually find employment
The table below decomposes labor utilization into these two components for selected benchmark years.
| Country | Year | LFPR (%) | Unemployment (%) | Employed Population (%) | Remarks |
|---|---|---|---|---|---|
| Canada | 1991 | 66.2 | 10.3 | 59.4 | absorption-driven adjustment |
| 2008 | 67.3 | 6.3 | 63.0 | ||
| 2021 | 65.2 | 7.5 | 60.3 | ||
| 2024 | 64.7 | 6.4 | 60.6 | ||
| Germany | 1991 | 59.6 | 5.3 | 56.4 | absorption-driven improvement |
| 2008 | 59.1 | 7.5 | 54.7 | ||
| 2021 | 60.4 | 3.6 | 58.2 | ||
| 2024 | 60.9 | 3.4 | 58.9 | ||
| France | 1991 | 55.0 | 9.1 | 50.0 | stable low utilization |
| 2008 | 56.1 | 7.4 | 52.0 | ||
| 2021 | 55.6 | 7.9 | 51.2 | ||
| 2024 | 55.7 | 7.4 | 51.5 | ||
| United Kingdom | 1991 | 62.0 | 8.6 | 56.7 | absorption-driven improvement |
| 2008 | 62.2 | 5.7 | 58.6 | ||
| 2021 | 62.0 | 4.9 | 59.0 | ||
| 2024 | 61.6 | 4.4 | 58.9 | ||
| Italy | 1991 | 50.3 | 10.1 | 45.3 | persistently low utilization |
| 2008 | 48.9 | 6.7 | 45.6 | ||
| 2021 | 48.4 | 9.5 | 43.8 | ||
| 2024 | 49.6 | 6.5 | 46.4 | ||
| Japan | 1991 | 63.8 | 2.1 | 62.5 | recovery after decline |
| 2008 | 60.2 | 4.0 | 57.7 | ||
| 2021 | 62.1 | 2.8 | 60.3 | ||
| 2024 | 63.3 | 2.5 | 61.7 | ||
| United States | 1991 | 65.0 | 6.8 | 60.6 | participation-driven decline |
| 2008 | 65.0 | 5.8 | 61.2 | ||
| 2021 | 61.5 | 5.3 | 58.2 | ||
| 2024 | 62.0 | 4.0 | 59.5 | ||
Table 12-1. Decomposition of labor utilization in the G7 (selected years).
Employed population reflects the combined effect of participation (LFPR) and unemployment.
Source: World Bank, World Development Indicators (SL.TLF.CACT.ZS; SL.UEM.TOTL.ZS).
The decomposition table shows that similar levels of labor utilization may emerge through different adjustment channels.
Germany and the United Kingdom improve mainly through lower unemployment. Canada also benefits from lower unemployment, although its path is less monotonic. Japan shows decline followed by recovery, while maintaining comparatively low unemployment throughout. The United States, by contrast, shows a later decline associated more with reduced participation than with worsening unemployment.
France remains broadly stable at a lower level, while Italy remains persistently weak. In these cases, lower labor utilization is not a short-lived fluctuation but a more durable structural condition.
5. Structural Interpretation
Viewed over time, labor utilization in the G7 shows both movement and persistence.
There is some narrowing in overall levels compared with the early 1990s, but the adjustment is incomplete. Several economies move toward a narrower range around the upper 50s or low 60s, yet France and Italy remain distinctly below that band, while Japan stays near the upper end of the distribution.
This means that labor utilization is not governed by a single common trajectory. Instead, economies adjust through different combinations of participation and absorption, and these differences remain visible even over long horizons.
6. Looking Ahead
If labor utilization evolves through different adjustment channels, the next question becomes clear:
Why do some economies improve mainly through absorption, while others move through participation—or remain persistently constrained?
This question connects labor utilization back to the structure of labor markets and to the mechanisms discussed in DISCUSSION #002 — Labor Market Segmentation & Mobility Constraints.
The patterns observed here describe how labor is utilized across economies. But they do not yet tell us what drives these differences or how they evolve over time. To understand the dynamics behind labor utilization, we must move beyond outcomes and examine the forces that shape them.
Next:
EPISODE #013 — What Drives Changes in Labor Utilization Over Time?
All tables and figures on this site are generated from publicly available macroeconomic datasets.