EPISODE #014 — What Shapes Labor Force Participation?
In EPISODE #013, we saw that labor force participation plays a central role in shaping overall labor utilization. But participation itself is not a primitive quantity. It is an aggregate — one number summarizing the behavior of different groups within the population.
To understand participation, we must look beneath it.
In this episode, Japan is used as an entry point to reveal the internal structure of participation. The purpose is not to represent all countries, but to make the structure visible.
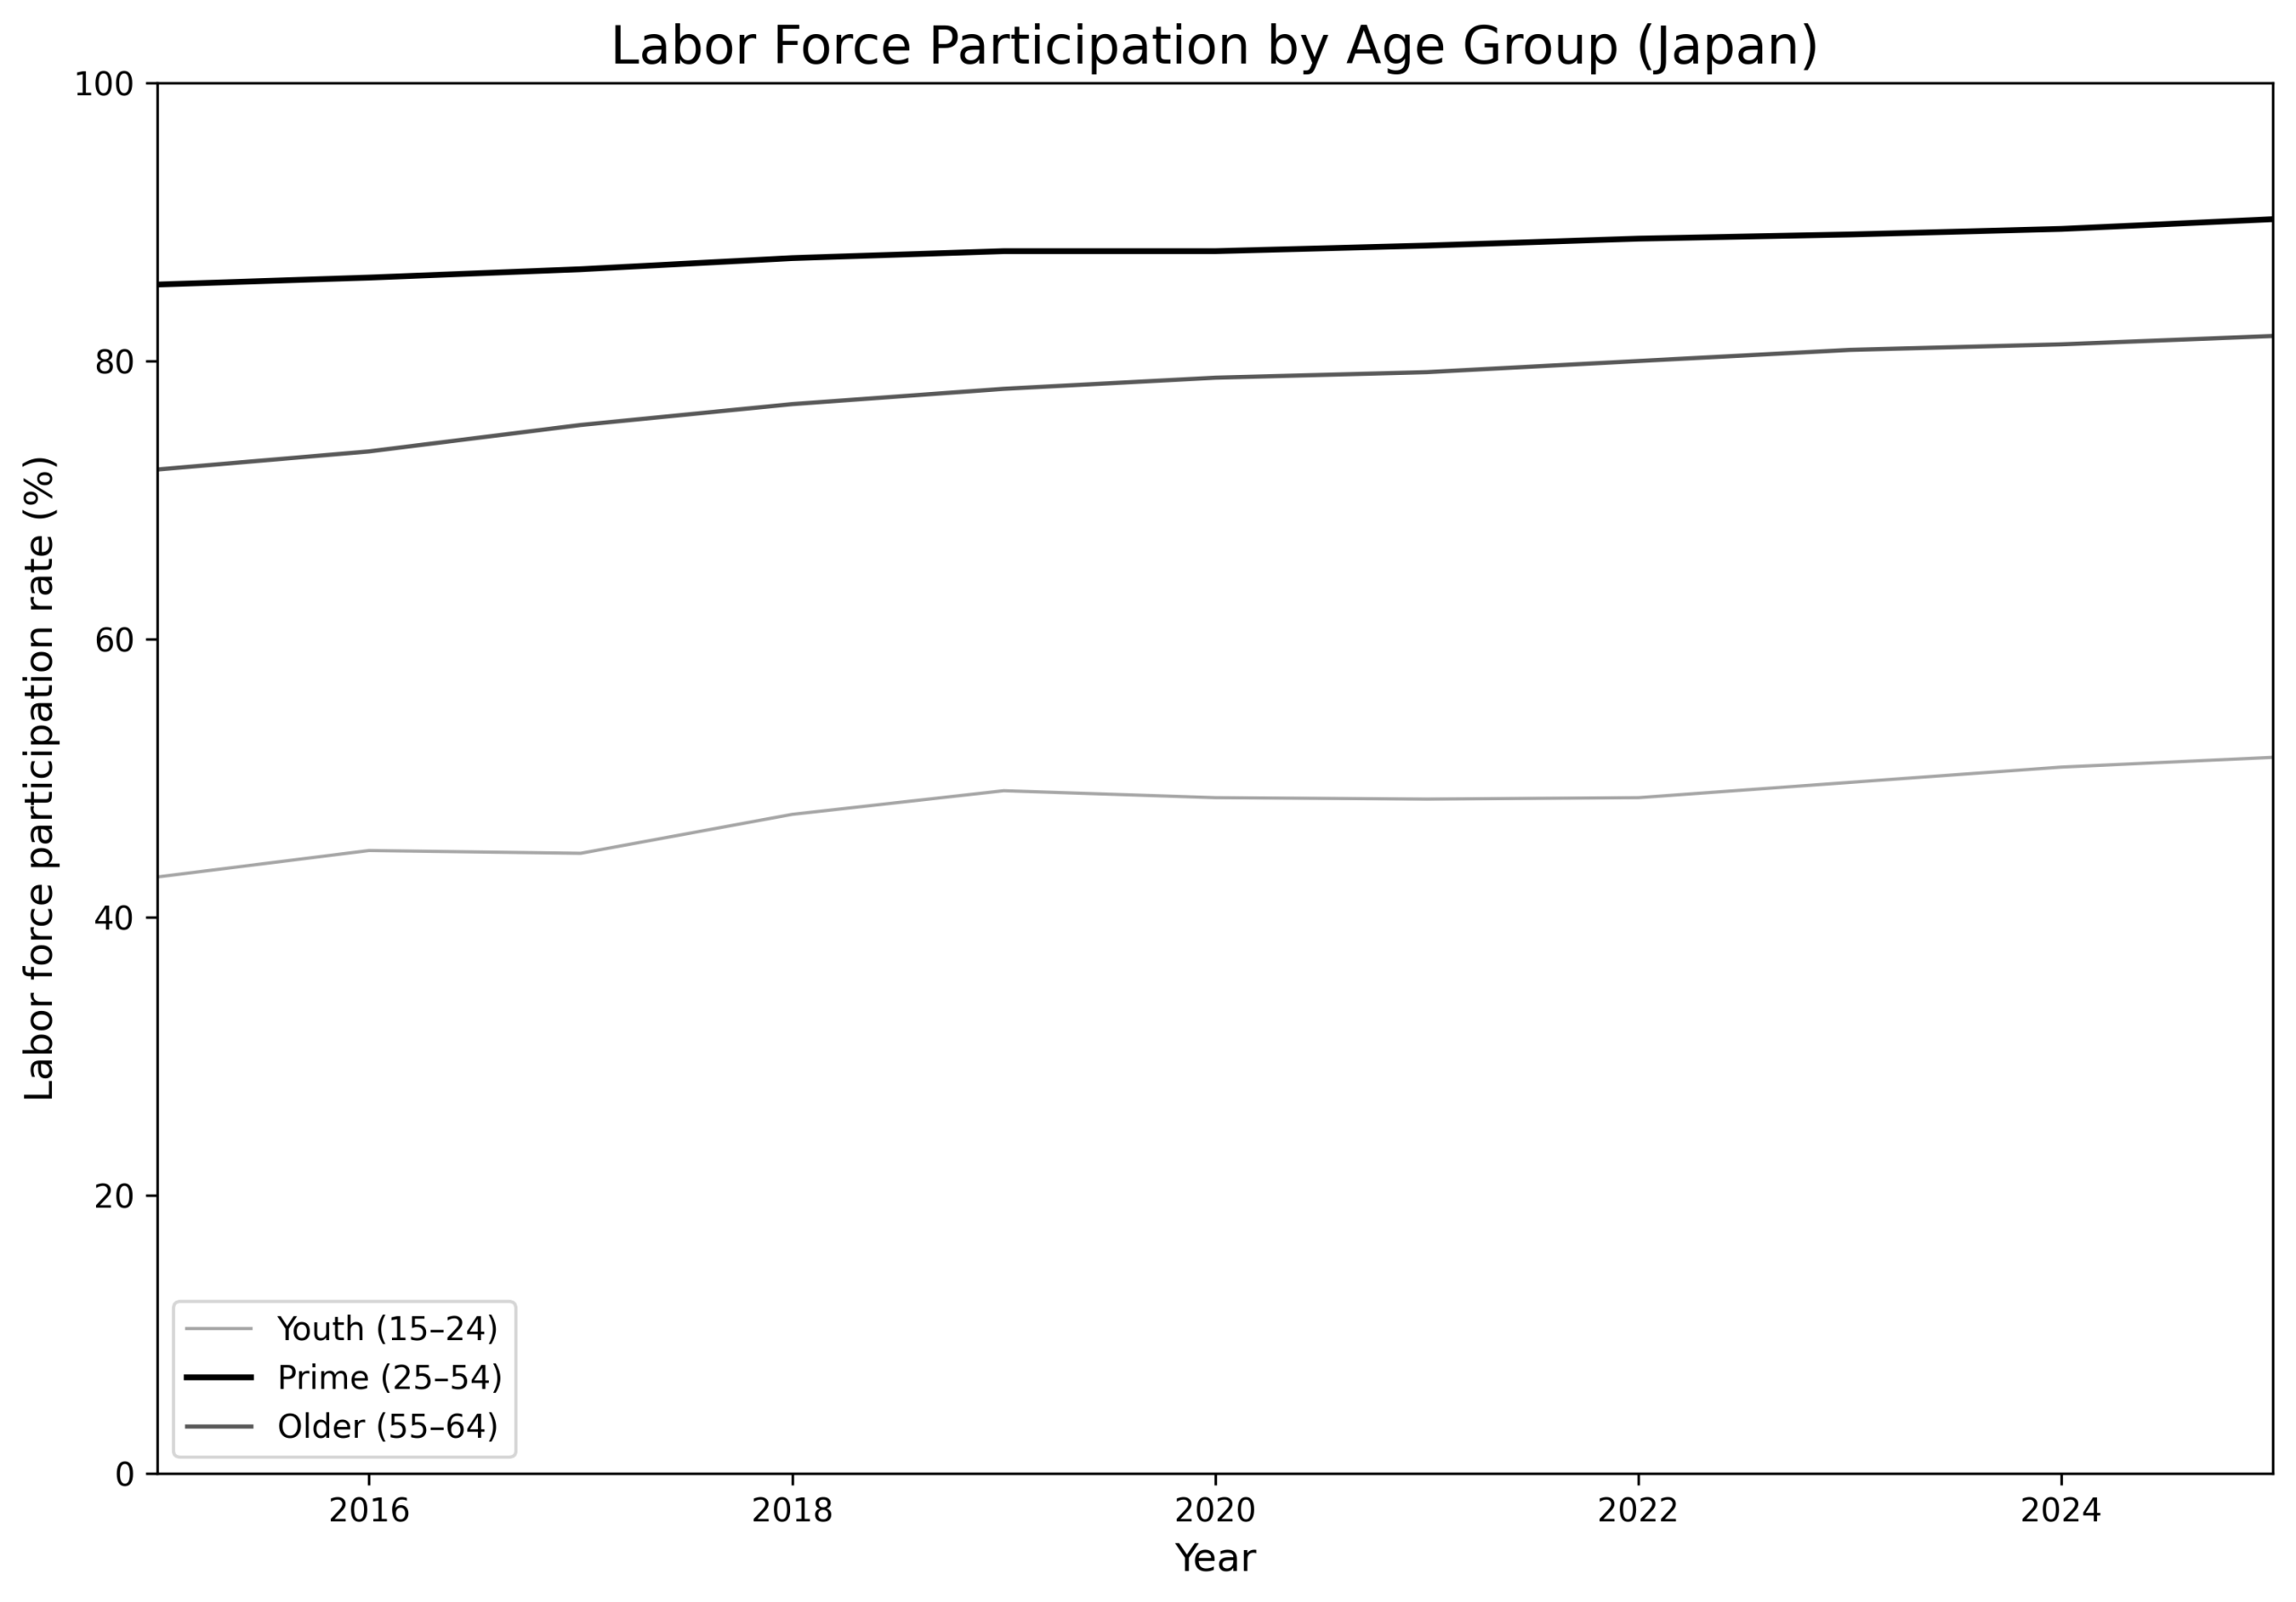
Figure 1 shows labor force participation rates in Japan, decomposed into three age groups: youth (15–24), prime-age workers (25–54), and older workers (55–64). At first glance, participation may appear to be a single national rate. But this figure reveals a more structured reality.
Participation among prime-age workers remains high and relatively stable over time. By contrast, participation among older workers has risen steadily, while youth participation remains lower and follows a different path. The aggregate participation rate, therefore, is not the result of a single underlying movement. It is the combined outcome of distinct groups evolving in different ways.
Participation is not a single behavior. It is a composition of multiple groups, each with its own dynamics.
This episode uses ILOSTAT data to obtain consistent age-group participation rates. While EPISODE #013 relied on World Bank indicators, both sources are based on harmonized labor force statistics, so the shift in source is consistent with the present purpose of examining age-group structure.
1. From Observation to Structure
At this point, the question becomes more precise.
If participation is the combined outcome of different groups, how exactly are these groups aggregated into a single rate?
To answer this, we need to move from observation to structure.
Participation is not simply a number reported at the national level. It is constructed from the participation behavior of different segments of the population, each with its own size and dynamics.
This distinction matters because participation rates are not shares. The participation rate of youth, the participation rate of prime-age workers, and the participation rate of older workers do not add up to 100 percent. Each rate is measured within its own population group.
The aggregate rate is therefore not a simple sum. It is a weighted combination.
Group participation rates are rates, not shares. They do not add up to 100 percent. The aggregate rate is produced by weighting each group’s participation rate by that group’s population share.
2. The Structural Identity
The overall labor force participation rate can be understood as a weighted combination of group-specific participation rates:
\[
LFPR = \sum_i \left( s_i \times LFPR_i \right)
\]
where \(s_i\) represents the population share of group \(i\), and \(LFPR_i\) represents the participation rate within that group.
In the present case, the index \(i\) refers to the three age groups: youth (15–24), prime-age workers (25–54), and older workers (55–64).
This expression makes explicit what was only implicit in Figure 1.
The aggregate participation rate depends on two elements:
- how large each group is
- how actively each group participates
A country may have a high aggregate participation rate because many people in each group participate actively. But it may also have a different aggregate outcome because the population weights are different. The same total rate can therefore hide different internal structures.
Participation is a weighted structure. It depends not only on behavior within groups, but also on the relative size of those groups.
3. Two Sources of Change
This structure reveals that changes in participation can arise from two distinct sources.
First, participation within a group may change. For example, older workers may remain in the labor force longer than before. This is a change in group behavior.
Second, the composition of the population may shift. Even if participation rates within each group remain unchanged, an increase in the share of older individuals will affect the aggregate rate. This is a change in demographic composition.
These two mechanisms — behavioral change and compositional change — are fundamentally different, yet both are reflected in the same aggregate number.
This is why the aggregate labor force participation rate should be read carefully. A movement in the total rate is not automatically a movement in one single behavior. It may reflect changes within groups, changes in the relative size of groups, or both.
A change in aggregate participation can come from behavior, composition, or both. The same movement in the total rate may therefore reflect different underlying structures.
4. Returning to Japan
We can now reinterpret Figure 1 in this light.
In Japan, participation among prime-age workers remains high and stable, suggesting little change in the core of the labor market. By contrast, participation among older workers has risen steadily, indicating a shift in behavior at the later stages of the working life cycle.
At the same time, demographic changes — particularly population aging — imply that the weight of older groups is increasing over time.
The observed evolution of the aggregate participation rate is therefore the combined result of these structural forces.
This is why total participation should not be read as a single movement. It is a compressed expression of multiple movements occurring beneath the surface.
A broader comparison across G7 economies reveals that similar participation structures can produce different aggregate outcomes. This cross-country perspective is explored further in DISCUSSION #010 — Participation Structure Across the G7.
Unresolved Question
We have now opened the black box of labor force participation.
Participation is not a single behavioral quantity. It is a weighted structure built from group-specific participation rates and the population shares of those groups.
This raises the next question.
When participation changes over time, how much of that change comes from changes in group behavior, and how much comes from changes in population composition?
This question naturally leads to the next episode:
EPISODE #015 — What Drives Changes in Participation Over Time?