EPISODE #008 — Does Labor Allocation Align with Value Creation?
In this episode we compare where people work (employment share by sector) with where value is created (value-added share by sector). If a sector’s share of value-added is larger than its share of employment, that sector is, on average, a relatively high-productivity place to work.
Takeaway
A simple structural test is to compare each sector’s value-added share with its employment share. The ratio RP = (value-added share) ÷ (employment share) shows where productivity is concentrated.
Employment shares by sector are available continuously for all G7 countries from 1991 to 2024 (34 years × 3 sectors = 102 observations per country). In the currently available public data, sectoral value-added shares are available from 1997 to 2021, while employment shares extend through 2024. Therefore, the latest fully comparable snapshot for allocation and value creation is 2021.
Table 1 compares sectoral employment shares with sectoral value-added shares in 2021. This is a direct comparison between labor allocation and economic contribution.
If a sector’s value-added share exceeds its employment share, that sector is, on average, contributing more to national output per worker than the economy-wide average. If it is lower, the sector’s average productivity is below the national mean. For example, in Japan, industry employs 23.70% of workers but produces 29.22% of value-added, suggesting that industry is a relatively high-productivity sector there.
| Country | Emp (Agr) | VA (Agr) | Emp (Ind) | VA (Ind) | Emp (Srv) | VA (Srv) |
|---|---|---|---|---|---|---|
| Canada | 1.37 | 1.60 | 19.34 | 25.33 | 79.30 | 66.39 |
| Germany | 1.21 | 0.75 | 27.38 | 25.16 | 71.41 | 63.55 |
| France | 2.52 | 1.46 | 19.52 | 16.09 | 77.97 | 70.67 |
| United Kingdom | 0.90 | 0.70 | 16.92 | 16.96 | 82.18 | 72.17 |
| Italy | 4.05 | 1.83 | 26.64 | 22.56 | 69.31 | 64.84 |
| Japan | 3.17 | 1.01 | 23.70 | 29.22 | 73.14 | 69.02 |
| United States | 1.66 | 0.96 | 19.18 | 17.89 | 79.15 | 77.60 |
Table 1. Employment share and value-added share by sector in the G7, 2021.
Source: World Bank, World Development Indicators; author’s calculation.
Note: Shares are expressed as percentages of total employment and total value added. Agr = agriculture, Ind = industry, Srv = services. Values are rounded to two decimal places.
Table 2 makes the structural signal explicit by calculating relative productivity (RP) for each sector. RP is defined as the sector’s value-added share divided by its employment share.
| Country | RP (Agr) | RP (Ind) | RP (Srv) |
|---|---|---|---|
| Canada | 1.17 | 1.31 | 0.84 |
| Germany | 0.62 | 0.92 | 0.89 |
| France | 0.58 | 0.82 | 0.91 |
| United Kingdom | 0.78 | 1.00 | 0.88 |
| Italy | 0.45 | 0.85 | 0.94 |
| Japan | 0.32 | 1.23 | 0.94 |
| United States | 0.58 | 0.93 | 0.98 |
Table 2. Relative productivity by sector in the G7, 2021.
Source: World Bank, World Development Indicators; author’s calculation.
Note: RP (relative productivity) is defined as value-added share divided by employment share. Agr = agriculture, Ind = industry, Srv = services. Values are rounded to two decimal places.
Takeaway
The RP table makes the structural signal explicit. In 2021, industry stands out as relatively high-productivity in Canada (RP 1.31) and Japan (RP 1.23), while in Germany (0.92) and the United States (0.93) it is closer to the national average.
Figure 1 visualizes the RP results. The horizontal line at RP = 1.0 marks the national average. Values above 1.0 indicate sectors that generate a larger share of value-added than their share of employment.
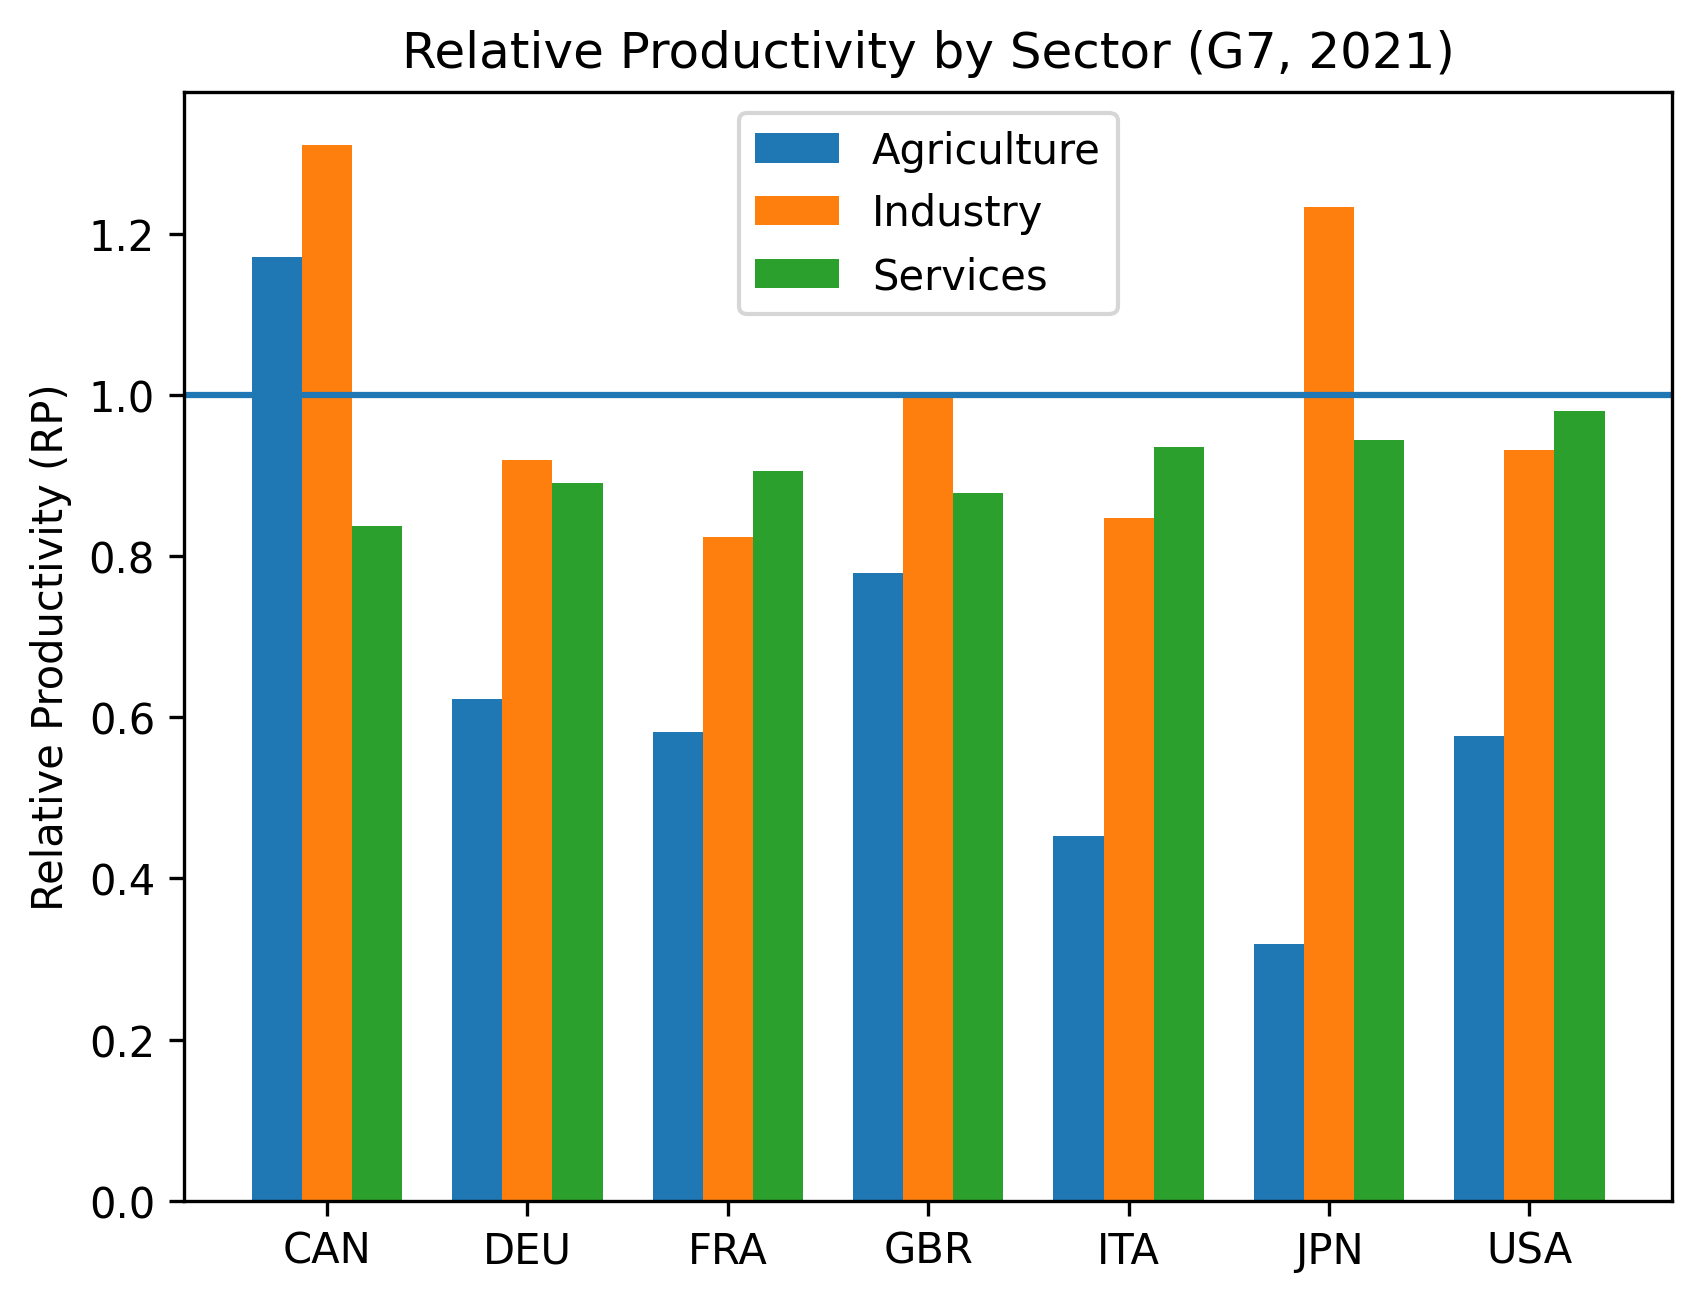
Figure 1. Relative productivity by sector in the G7, 2021.
Source: World Bank, World Development Indicators; author’s calculation.
Figure 1 summarizes the RP results visually. Industry stands clearly above the national average in Canada and Japan, indicating a relatively high concentration of productivity in that sector. Agriculture, by contrast, lies below the national average in most countries, reflecting a smaller value-added share relative to its employment share.
Employment shares are available through 2024, so labor allocation can also be tracked over time as agriculture shrinks, services expand, and industry rises or falls. This movement is important, but it is treated separately here because the value-added share series currently ends in 2021.
Unresolved Question:
→ Why do some economies compress sectoral productivity gaps while others maintain persistent structural duality?
Next:
EPISODE #009 — Why do productivity gaps shrink in some economies but persist in others?
All tables and figures on this site are generated from publicly available macroeconomic datasets.