EPISODE #013 — What Drives Changes in Labor Utilization Over Time?
The patterns observed in labor utilization raise a natural question: what drives these changes over time? The measures we have constructed describe how labor is used, but they do not yet explain why it evolves. To move forward, we shift from observation to explanation. Changes in labor utilization are not random fluctuations; they reflect underlying forces that shape how people participate in the labor market and how effectively they are employed. In this episode, we begin by decomposing these changes into their fundamental components, and then consider the structural mechanisms that drive them across time and across economies.
1. From Outcomes to Drivers
The measures introduced so far describe labor utilization as an outcome. They tell us how many people participate in the labor market and how many among them are employed. But these outcomes are the result of underlying processes. To understand change over time, we must look beneath the surface and identify the forces that move these variables. In this section, we begin by expressing labor utilization in a form that allows such drivers to be isolated and examined.
The total number of employed persons can be written as the product of the working-age population, the labor force participation rate, and the employment rate within the labor force:
E = P × LFPR × (1 − u)
where E denotes employed persons, P the working-age population, LFPR the labor force participation rate, and u the unemployment rate. This identity is intuitive: employment depends first on how many people belong to the working-age population, then on how many of them enter the labor market, and finally on how many among those participants succeed in obtaining work.
For cross-country comparison, however, the level form is not the most useful. Once both sides are divided by the working-age population, labor utilization E/P is expressed as a structural quantity:
E/P = LFPR × (1 − u)
By normalizing by population, all terms are expressed as shares. This removes scale and allows the structure of labor utilization to become visible. The share of the working-age population that is employed depends on two distinct margins: participation in the labor market and success in obtaining employment once participating.
2. Decomposing Change Over Time
This identity becomes analytically useful once we move from levels to changes. If labor utilization changes between two periods, that change must arise from changes in one or both of its components: participation and unemployment.
A simple first-order decomposition can be written as:
Δ(E/P) ≈ (1 − u)ΔLFPR − LFPRΔu
This expression has a clear interpretation. The first term captures the contribution of participation. If more individuals enter the labor force, labor utilization rises, provided that a sufficient fraction of participants are employed. The second term captures the contribution of unemployment. If unemployment rises, labor utilization falls, and if unemployment declines, labor utilization improves.
For numerical work, the decomposition can be computed exactly by adding the interaction term:
Δ(E/P) = (1 − u0)ΔLFPR − LFPR0Δu − ΔLFPR·Δu
where the subscript 0 denotes the initial period. This exact form ensures that the component contributions sum precisely to the observed total change.
Labor utilization changes through two main margins: participation and employment conditions. The decomposition allows us to ask not only whether labor utilization changed, but how that change was generated.
3. A Worked Example
Before turning to country evidence, it is useful to see how the decomposition works in a simple two-period example. Suppose the labor force participation rate rises from 70.0% to 72.0%, while the unemployment rate falls from 6.0% to 5.0%. Labor utilization therefore rises from 65.8% to 68.4%, an increase of 2.6 percentage points.
| Variable | Year 0 | Year 1 | Change |
|---|---|---|---|
| Labor force participation rate (LFPR) | 70.0% | 72.0% | +2.0 pp |
| Unemployment rate (u) | 6.0% | 5.0% | −1.0 pp |
| Employment rate within labor force (1 − u) | 94.0% | 95.0% | +1.0 pp |
| Labor utilization (E/P) | 65.8% | 68.4% | +2.6 pp |
| Contribution | Value |
|---|---|
| Participation effect ((1 − u)ΔLFPR) | +1.88 pp |
| Unemployment effect (−LFPRΔu) | +0.70 pp |
| Interaction term (−ΔLFPRΔu) | +0.02 pp |
| Total change in E/P | +2.60 pp |
This example shows how the decomposition works numerically. A change in labor utilization can be attributed to a participation effect, an unemployment effect, and a small interaction term. With this analytical tool in hand, we can now turn to the G7.
4. Germany: A First Empirical Illustration
As a first empirical illustration, we begin with Germany, where both labor force participation and unemployment exhibit meaningful changes over time, allowing the decomposition to be observed in a balanced and transparent manner.
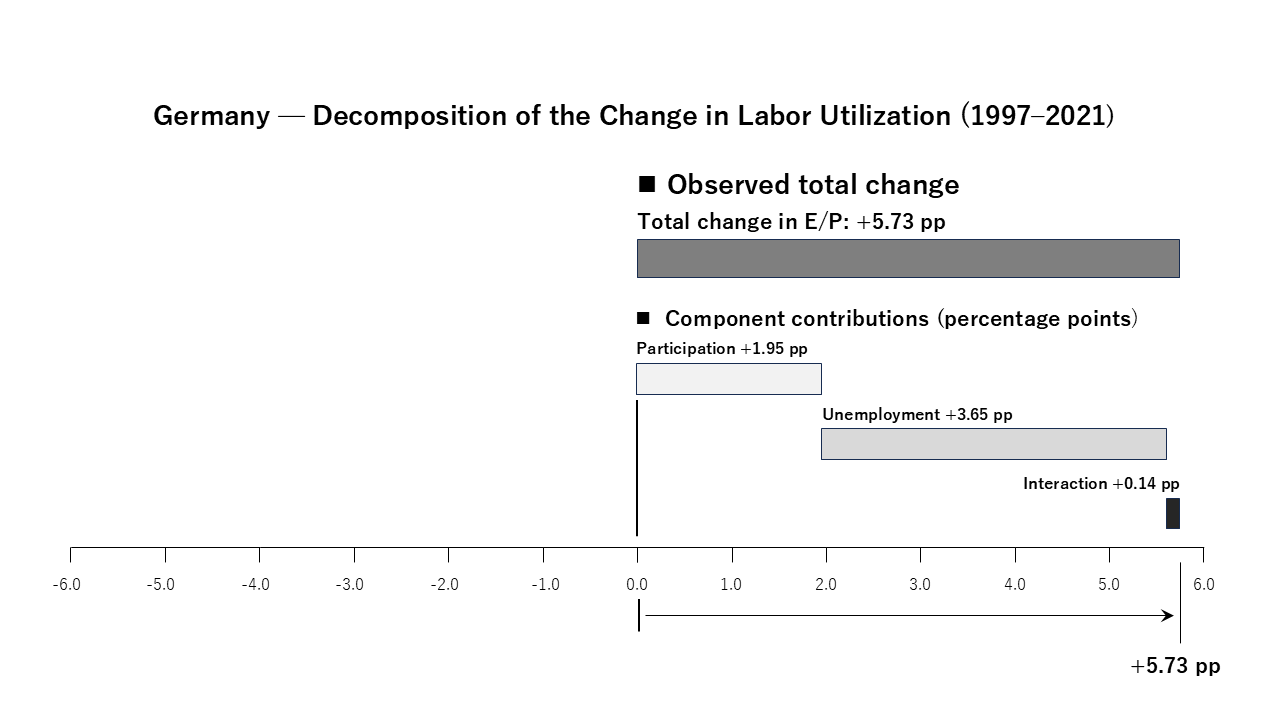
Figure 13-1. Germany — Decomposition of the Change in Labor Utilization (1997–2021). Note: World Bank, World Development Indicators. Labor force participation rate (SL.TLF.CACT.ZS); unemployment rate (SL.UEM.TOTL.ZS). Authors’ calculations.
Between 1997 and 2021, labor utilization in Germany increased from 52.5% to 58.2%, a gain of 5.7 percentage points. The decomposition reveals that this increase was driven primarily by a decline in unemployment. The unemployment rate fell from 9.9% to 3.6%, contributing 3.65 percentage points to the overall rise in labor utilization. Labor force participation also increased, contributing 1.95 percentage points, while the interaction term remained small.
Germany therefore provides a clear example of an unemployment-driven improvement in labor utilization. The dominant force was not a large expansion of participation, but a marked strengthening of employment conditions.
5. A Cross-Country Comparison
Across the G7, changes in labor utilization over the past decades do not follow a single pattern. While the overall outcomes range from strong increases to notable declines, the underlying drivers differ systematically across countries. In some economies, improvements in labor utilization are driven primarily by declining unemployment. In others, participation plays the dominant role—either supporting increases or driving declines. The decomposition makes clear that similar outcomes can emerge from very different structural forces.
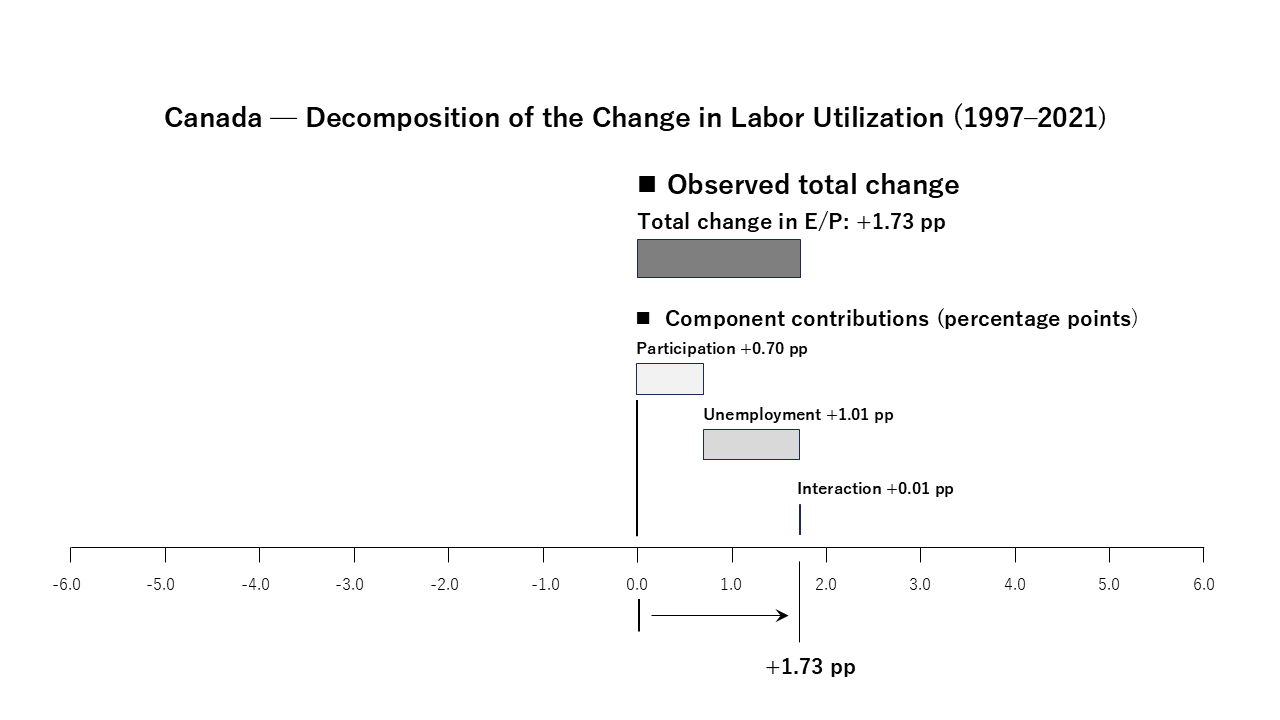
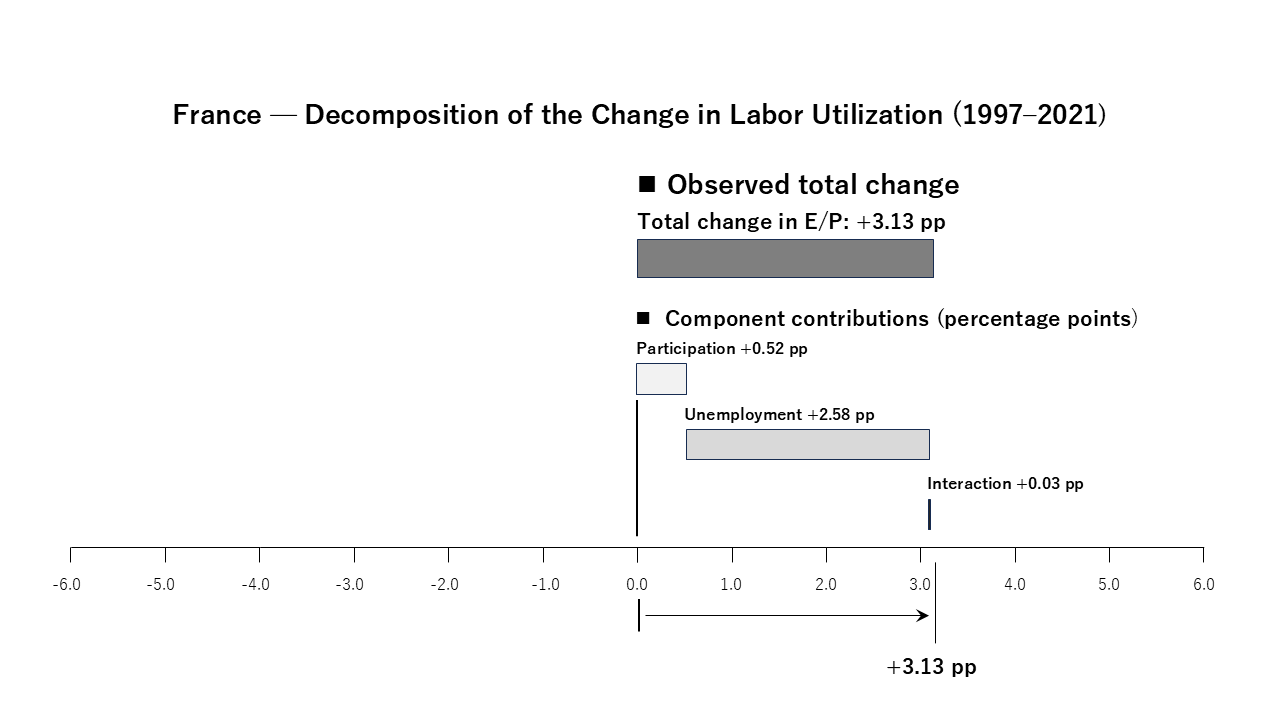
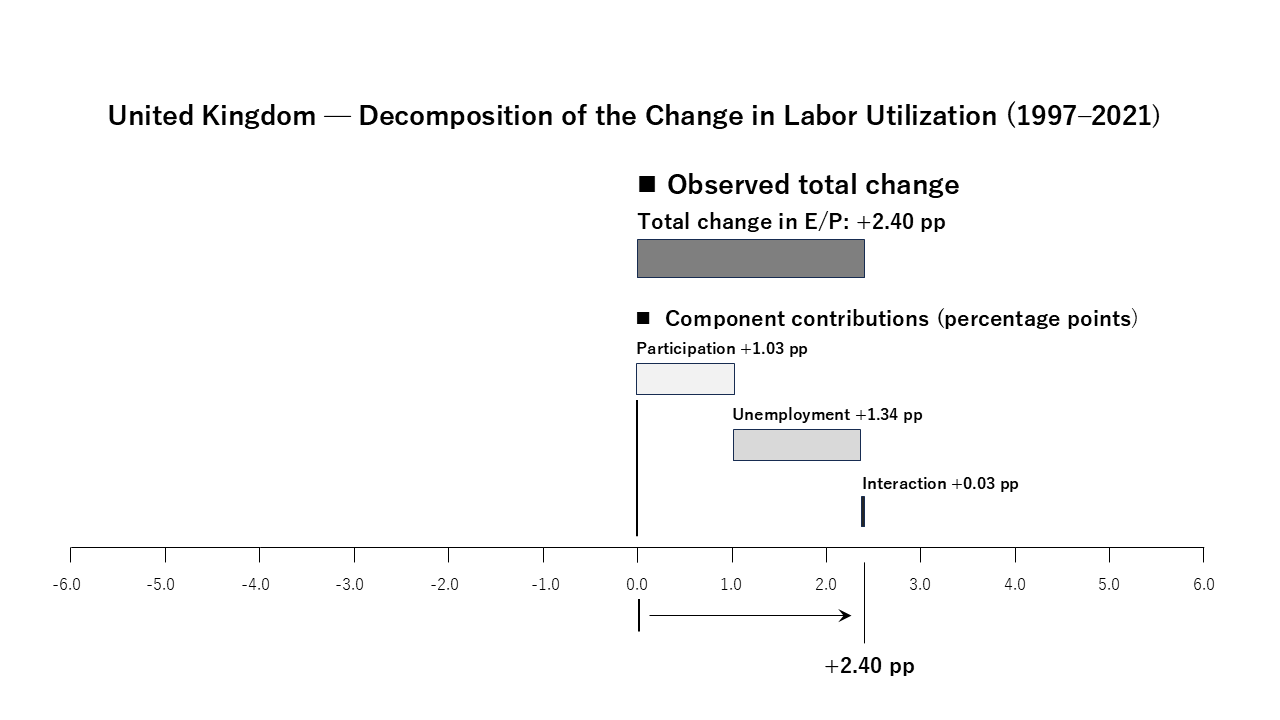
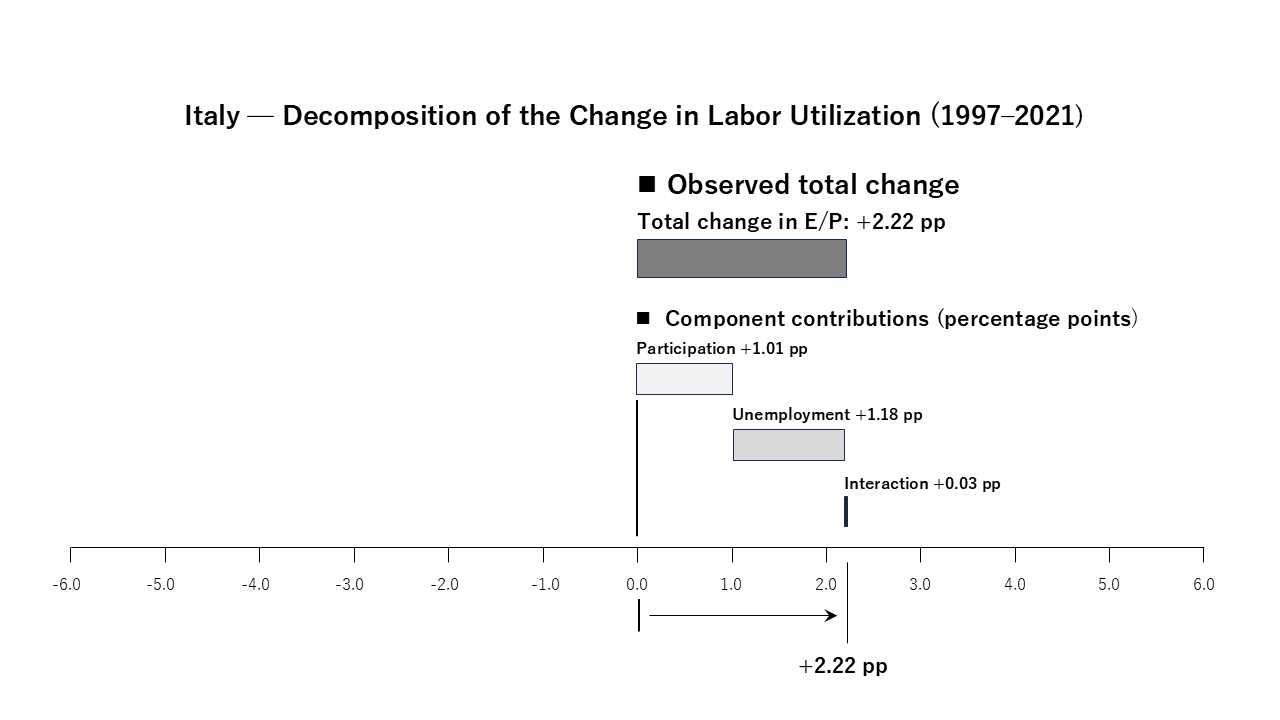
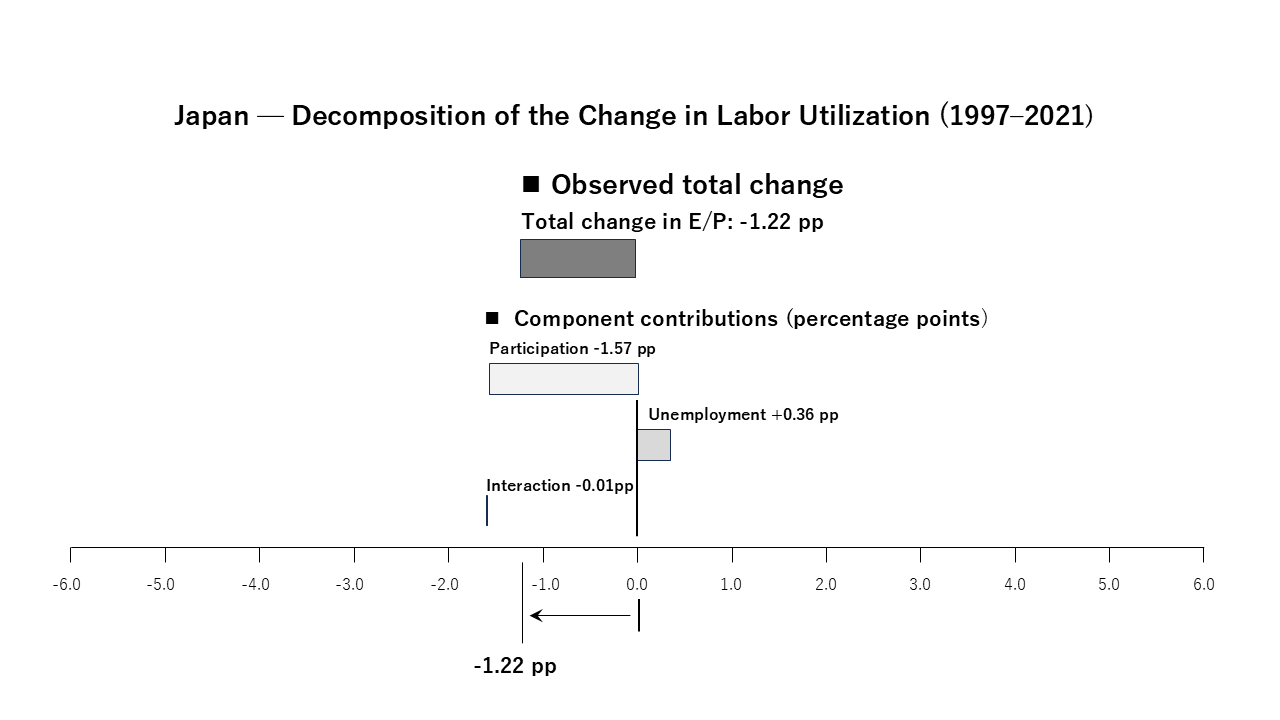
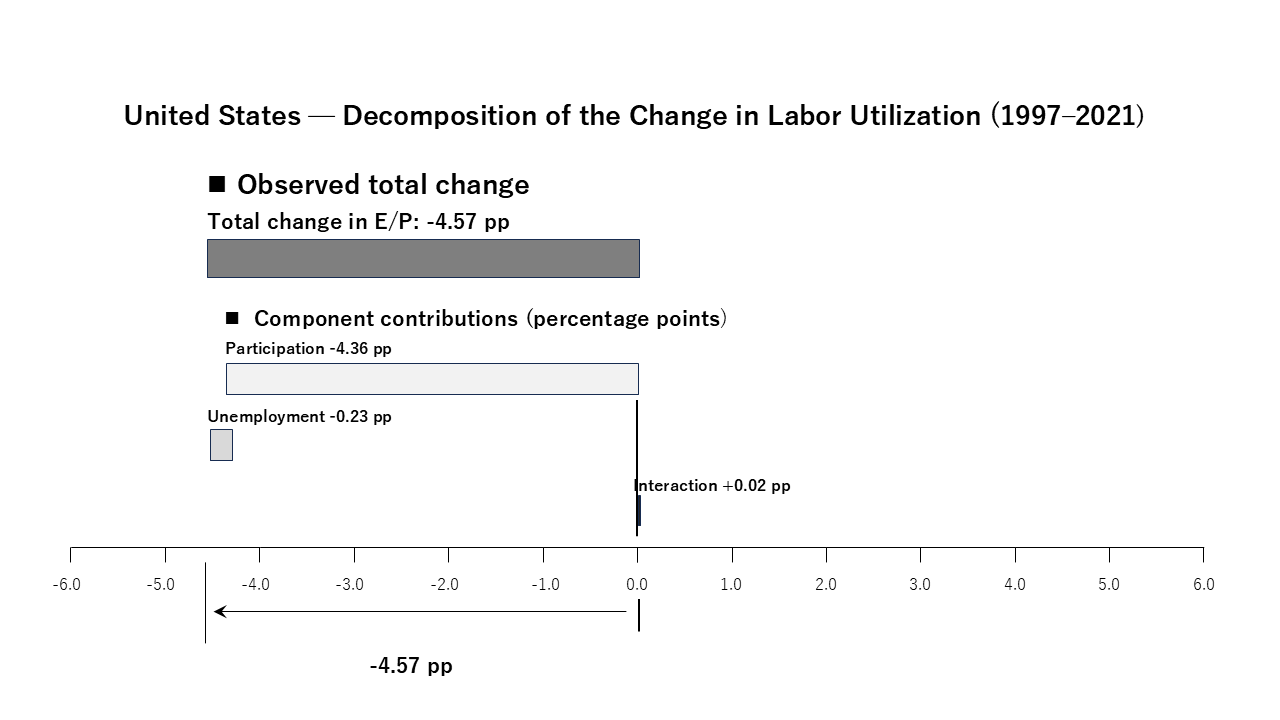
Figure 13-2. Decomposition of the Change in Labor Utilization across the G7 (1997–2021). Note: World Bank, World Development Indicators. Labor force participation rate (SL.TLF.CACT.ZS); unemployment rate (SL.UEM.TOTL.ZS). Authors’ calculations.
The decomposition reveals three broad patterns across the G7. In Germany and France, increases in labor utilization are driven primarily by declines in unemployment, indicating improvements in the capacity of the labor market to absorb workers. In Canada, the United Kingdom, and Italy, both participation and unemployment contribute positively, producing more balanced and moderate increases. In contrast, Japan and the United States exhibit declines in labor utilization driven mainly by reductions in participation, with changes in unemployment playing a secondary role.
Taken together, these patterns suggest that cross-country variation in labor utilization is shaped less by unemployment alone than by the dynamics of participation. In structural terms, the same outcome—an increase or a decline in labor utilization—can emerge from fundamentally different combinations of participation and employment conditions.
Differences in labor utilization across the G7 are not generated by a single mechanism. Some economies improve mainly through falling unemployment, while others rise or fall chiefly through changes in participation.
6. What This Episode Has Shown
This episode has moved from observed outcomes to their immediate drivers. Labor utilization can be decomposed into participation and unemployment, and changes in labor utilization can in turn be attributed to changes in these two margins. Applied to the G7, this framework reveals that participation is often as important as unemployment—and in some cases more so.
But participation itself is not a primitive quantity. It is an aggregate outcome reflecting both the composition of the population and the participation behavior of different groups within it. To understand why participation differs so much across countries, we must now examine how participation is structured.
Next Episode
EPISODE #014 — The Structure of Participation
If labor utilization is often driven by participation, the next question is clear: what is participation made of? In the next episode, we open this aggregate margin and examine how labor force participation reflects the composition of the population and the behavior of different groups within it.
All tables and figures on this site are generated from publicly available macroeconomic datasets.