EPISODE #009 — Why do productivity gaps shrink in some economies but persist in others?
In the previous episode, we compared where people work with where value is created. That comparison revealed sectoral productivity differences. The next question is whether those differences narrow over time or remain wide.
This episode uses sectoral relative productivity to ask whether an economy structurally compresses or maintains persistent duality. Compression means sectoral gaps narrow. Duality means high- and low-productivity sectors remain far apart.
Takeaway
Sectoral productivity gaps are not fixed. They shrink when productivity converges across sectors and when labor reallocates smoothly. They persist when low-productivity sectors remain structurally insulated from diffusion of capital, technology, and talent, or when mobility is slow.
In earlier episodes, we introduced the structural data: sectoral employment shares, sectoral value-added shares, and relative productivity. Here they are used for one purpose: to measure whether an economy narrows its internal productivity gaps or preserves them over time.
1. Definitions
We work with three sectors: Agriculture, Industry, and Services. For each sector \(i\), labor productivity is defined as:
\[
P_i=\frac{VA_i}{Emp_i}
\]
To compare sectors within each country, we normalize sectoral productivity by the economy-wide average productivity \(\bar{P}\) and define relative productivity:
\[
RP_i=\frac{P_i}{\bar{P}}
\]
Interpretation is direct: \(RP > 1\) means above-average productivity, while \(RP < 1\) means below-average productivity. Compression means sectoral \(RP\) values move closer to 1 over time.
2. Measuring Structural Gaps
For this episode, we use the L1 dispersion from parity, that is, the average distance of sectoral relative productivity from \(RP=1\). With \(N\) sectors (here \(N=3\)), the measure is:
\[
D_{L1}=\frac{1}{N}\sum_i \left| RP_i-1 \right|
\]
Here, \(i\) runs over the three sectors: agriculture, industry, and services.
A value of \(D_{L1}\approx 0\) implies strong compression, meaning that sectoral productivity levels are similar. Larger values imply wider productivity gaps and a higher risk of persistent duality.
Table 1 provides the minimum numerical comparison. It reports sectoral relative productivity and L1 dispersion for the first and last years available in the currently available public data: 1997 and 2021.
| Country | Year | RP (Agr) | RP (Ind) | RP (Srv) | L1 Dispersion |
|---|---|---|---|---|---|
| Canada | 1997 | 0.77 | 1.30 | 0.92 | 0.61 |
| Canada | 2021 | 1.25 | 1.40 | 0.90 | 0.76 |
| Germany | 1997 | 0.39 | 0.90 | 1.09 | 0.80 |
| Germany | 2021 | 0.70 | 1.03 | 0.99 | 0.34 |
| France | 1997 | 0.57 | 0.90 | 1.07 | 0.61 |
| France | 2021 | 0.66 | 0.93 | 1.03 | 0.43 |
| United Kingdom | 1997 | 0.51 | 0.97 | 1.02 | 0.54 |
| United Kingdom | 2021 | 0.87 | 1.12 | 0.98 | 0.27 |
| Italy | 1997 | 0.54 | 0.86 | 1.12 | 0.71 |
| Italy | 2021 | 0.51 | 0.95 | 1.05 | 0.59 |
| Japan | 1997 | 0.27 | 1.07 | 1.03 | 0.83 |
| Japan | 2021 | 0.32 | 1.24 | 0.95 | 0.97 |
| United States | 1997 | 0.50 | 1.03 | 1.01 | 0.54 |
| United States | 2021 | 0.60 | 0.97 | 1.02 | 0.45 |
Table 1. Sectoral relative productivity and L1 dispersion in the G7, 1997 and 2021.
Source: World Bank, World Development Indicators; author’s calculation.
Note: RP denotes sectoral relative productivity. L1 dispersion is the average absolute distance of sectoral RP values from 1. Agr = agriculture, Ind = industry, Srv = services. Values are rounded to two decimal places.
Takeaway
Table 1 already reveals the core contrast. Germany’s dispersion falls sharply, indicating compression, while Japan’s remains high and increases slightly, indicating persistent duality.
Figure 1 makes the trajectory easier to see by comparing Japan and Germany from 1997 to 2021.
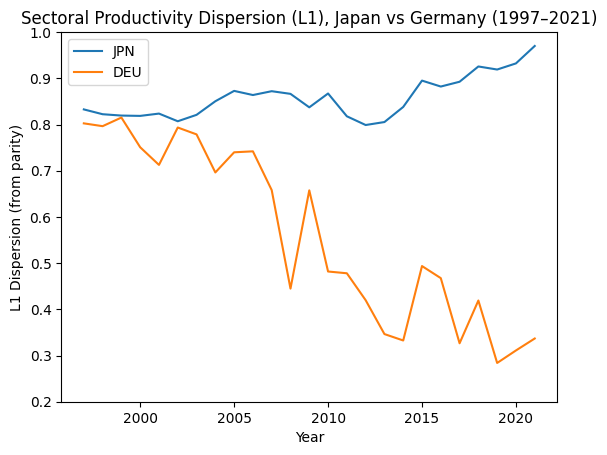
Figure 1. Sectoral productivity dispersion (L1 from parity), Japan vs Germany, 1997–2021.
Source: World Bank, World Development Indicators.
Figure 1 shows that Germany’s dispersion steadily declines, indicating that sectoral productivity levels move closer together over time. Japan follows the opposite pattern: dispersion remains persistently high and rises slightly by the end of the period. The contrast makes the distinction between compression and duality visually unmistakable.
3. What Creates Compression — and What Preserves Duality
Compression usually emerges through two mechanisms:
- Productivity convergence: lagging sectors upgrade, and diffusion of capital, technology, and management extends beyond frontier firms.
- Labor reallocation: workers can move from lower-productivity activities into higher-productivity ones without excessive friction.
Persistent duality is commonly associated with a different set of forces:
- Segmentation: protected or insulated low-productivity sectors remain separated from competitive pressure and diffusion.
- Fragmentation: large numbers of micro-firms limit scaling, investment, and organizational upgrading.
- Slow mobility: demography, geography, credentialing, and labor-market frictions reduce movement across sectors.
- Uneven capital deepening: frontier firms advance while the tail stagnates.
Takeaway
Compression is an outcome of diffusion and mobility. Duality is an outcome of segmentation. A high-income economy can remain internally divided into multiple productivity worlds.
EPISODE #009 is not about who is rich. It is about how a rich economy is internally structured — and whether its sectors are converging into one productivity world or remaining split across multiple worlds.
Unresolved Question:
→ What policies or institutions accelerate diffusion and mobility enough to compress gaps without destroying local resilience?
All tables and figures on this site are generated from publicly available macroeconomic datasets.
Next:
EPISODE #010 — Do Structural Productivity Gaps Shrink Over Time?
Why Does Structural Misalignment Persist?
The comparison between employment shares and value-added shares reveals an important structural feature of modern economies. Labor is not always located where productivity is highest.
If workers could move freely and instantly across sectors, such gaps would gradually narrow as labor shifts toward more productive activities. Yet in practice these differences often persist for long periods.
Why does labor not move more rapidly toward higher-productivity sectors?
One important part of the answer lies in the way labor markets actually function. Institutional arrangements, skill requirements, and firm structures often limit how easily workers can move between sectors.
→ See DISCUSSION #002 — Labor Market Segmentation & Mobility Constraints
All tables and figures on this site are generated from publicly available macroeconomic datasets.