EPISODE #010 — Do Structural Productivity Gaps Shrink Over Time?
In the previous episode, we introduced L1 dispersion as a measure of structural distance between where labor is employed and where productivity is concentrated.
L1 dispersion is defined as the sum of the absolute distances of sectoral relative productivity values from 1 across agriculture, industry, and services. It measures how far an economy’s labor allocation is from a structurally balanced state.
A low L1 value means that labor allocation and sectoral productivity are relatively well aligned. A high L1 value means that productivity gaps remain large across sectors.
But one further question naturally follows. Even if structural dispersion exists, does it remain fixed? Or do economies gradually reduce it over time?
Structural imbalance is not static. Across the G7, some economies reduce sectoral productivity gaps over time, while others preserve them or even allow them to widen.
1. From Structural Dispersion to Structural Trajectory
L1 dispersion was introduced as a snapshot measure of sectoral imbalance. But a snapshot alone cannot tell us whether an economy is adjusting. To answer that question, we need to follow the same indicator through time.
If L1 declines, sectoral productivity gaps are compressing. If L1 remains broadly unchanged, structural imbalance persists. If L1 rises, the economy is becoming more structurally dispersed.
This episode therefore shifts the perspective from structure to structural dynamics. The question is no longer only whether productivity gaps exist, but whether economies succeed in narrowing them.
2. Three Structural Paths in the G7
When we track L1 dispersion from 1997 to 2021, the G7 does not move as one group. Instead, three broad structural paths appear:
- Compression: sectoral productivity gaps shrink over time.
- Persistence: sectoral productivity gaps remain broadly stable.
- Divergence: sectoral productivity gaps widen over time.
These categories are not abstract labels. They summarize how differently advanced economies adjust — or fail to adjust — their internal structure.
3. Compression
In some economies, such as the United Kingdom and Germany, L1 dispersion declines steadily. In these cases, labor allocation and sectoral productivity move closer together over time. This does not mean that all structural imbalance disappears. It means that the economy becomes progressively more aligned.
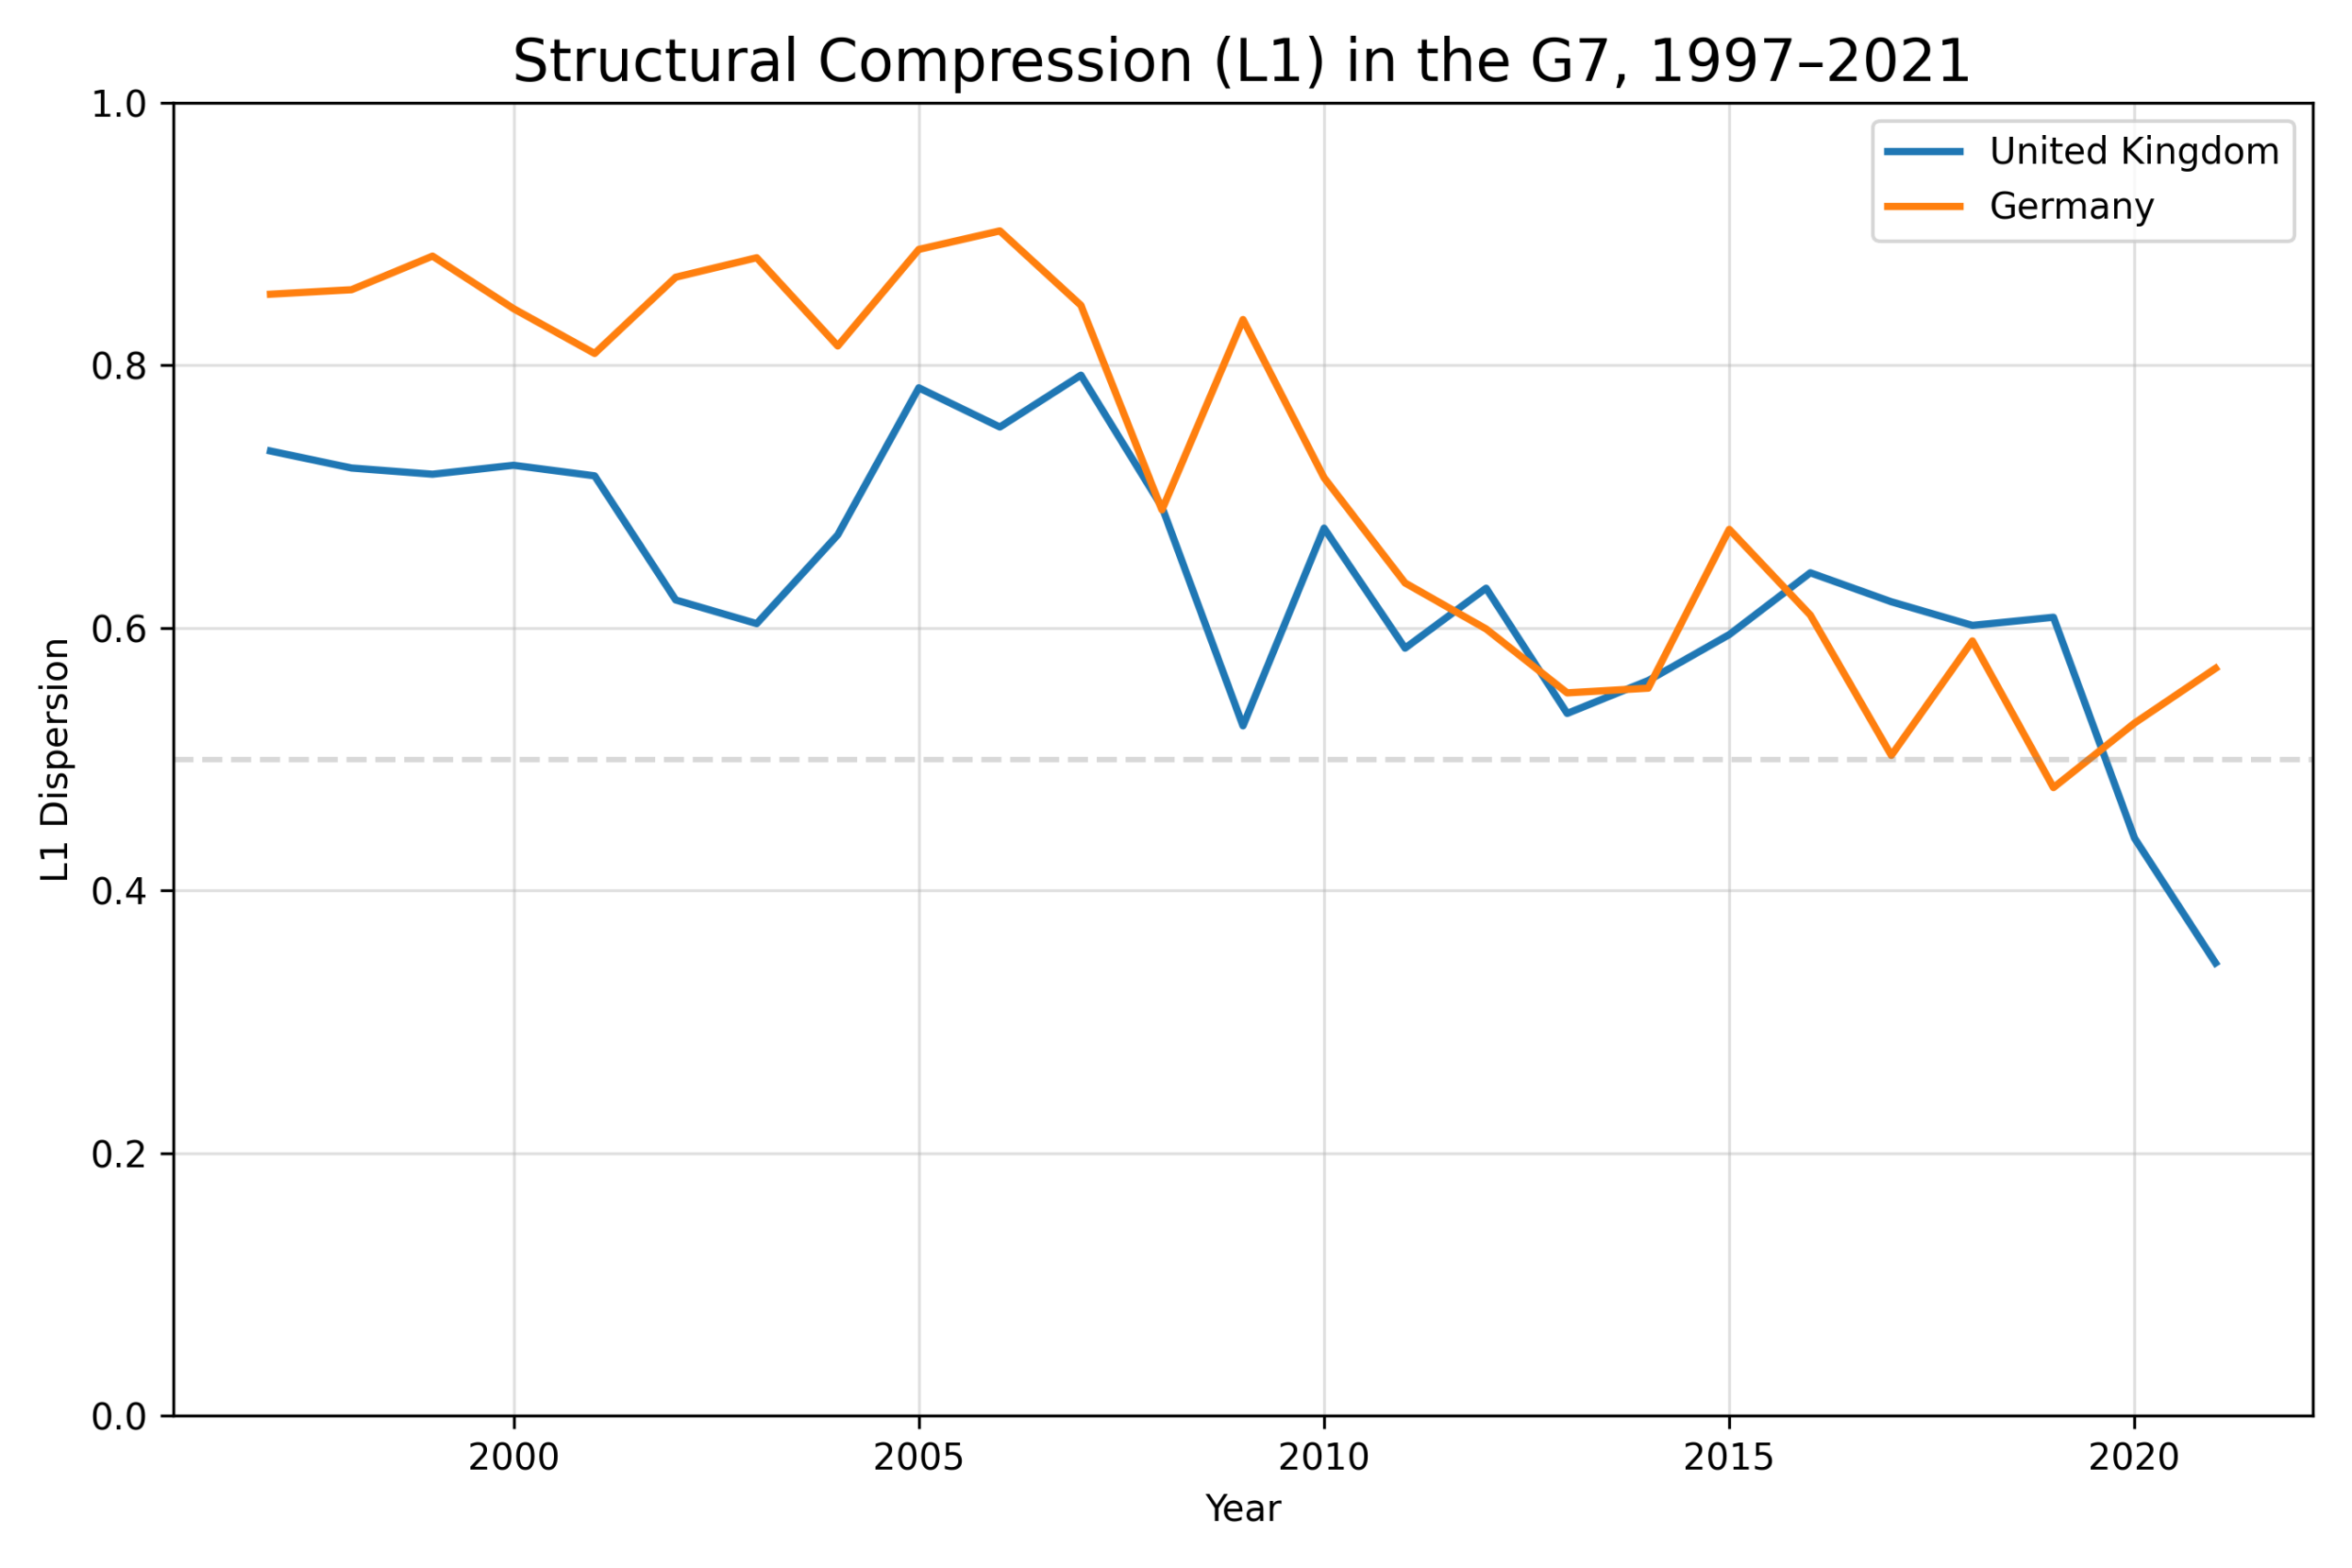
Figure 1. Structural compression in the G7, 1997–2021. L1 dispersion declines over time in the United Kingdom and Germany, indicating a sustained reduction in sectoral productivity gaps.
Source: World Bank, World Development Indicators (NV.AGR.TOTL.ZS, NV.IND.TOTL.ZS, NV.SRV.TOTL.ZS, SL.AGR.EMPL.ZS, SL.IND.EMPL.ZS, SL.SRV.EMPL.ZS).
The United Kingdom shows the strongest compression in this group, ending the period with a much lower level of dispersion than in the late 1990s. Germany also shows a clear long-run decline, although with some fluctuations. In both cases, the broad tendency is the same: structural imbalance narrows rather than deepens.
4. Persistence
Other economies, including France, the United States, and Canada, do not show such a strong directional shift. Their L1 dispersion moves up and down, but the overall structure remains broadly similar across the period. This is the pattern of persistence.
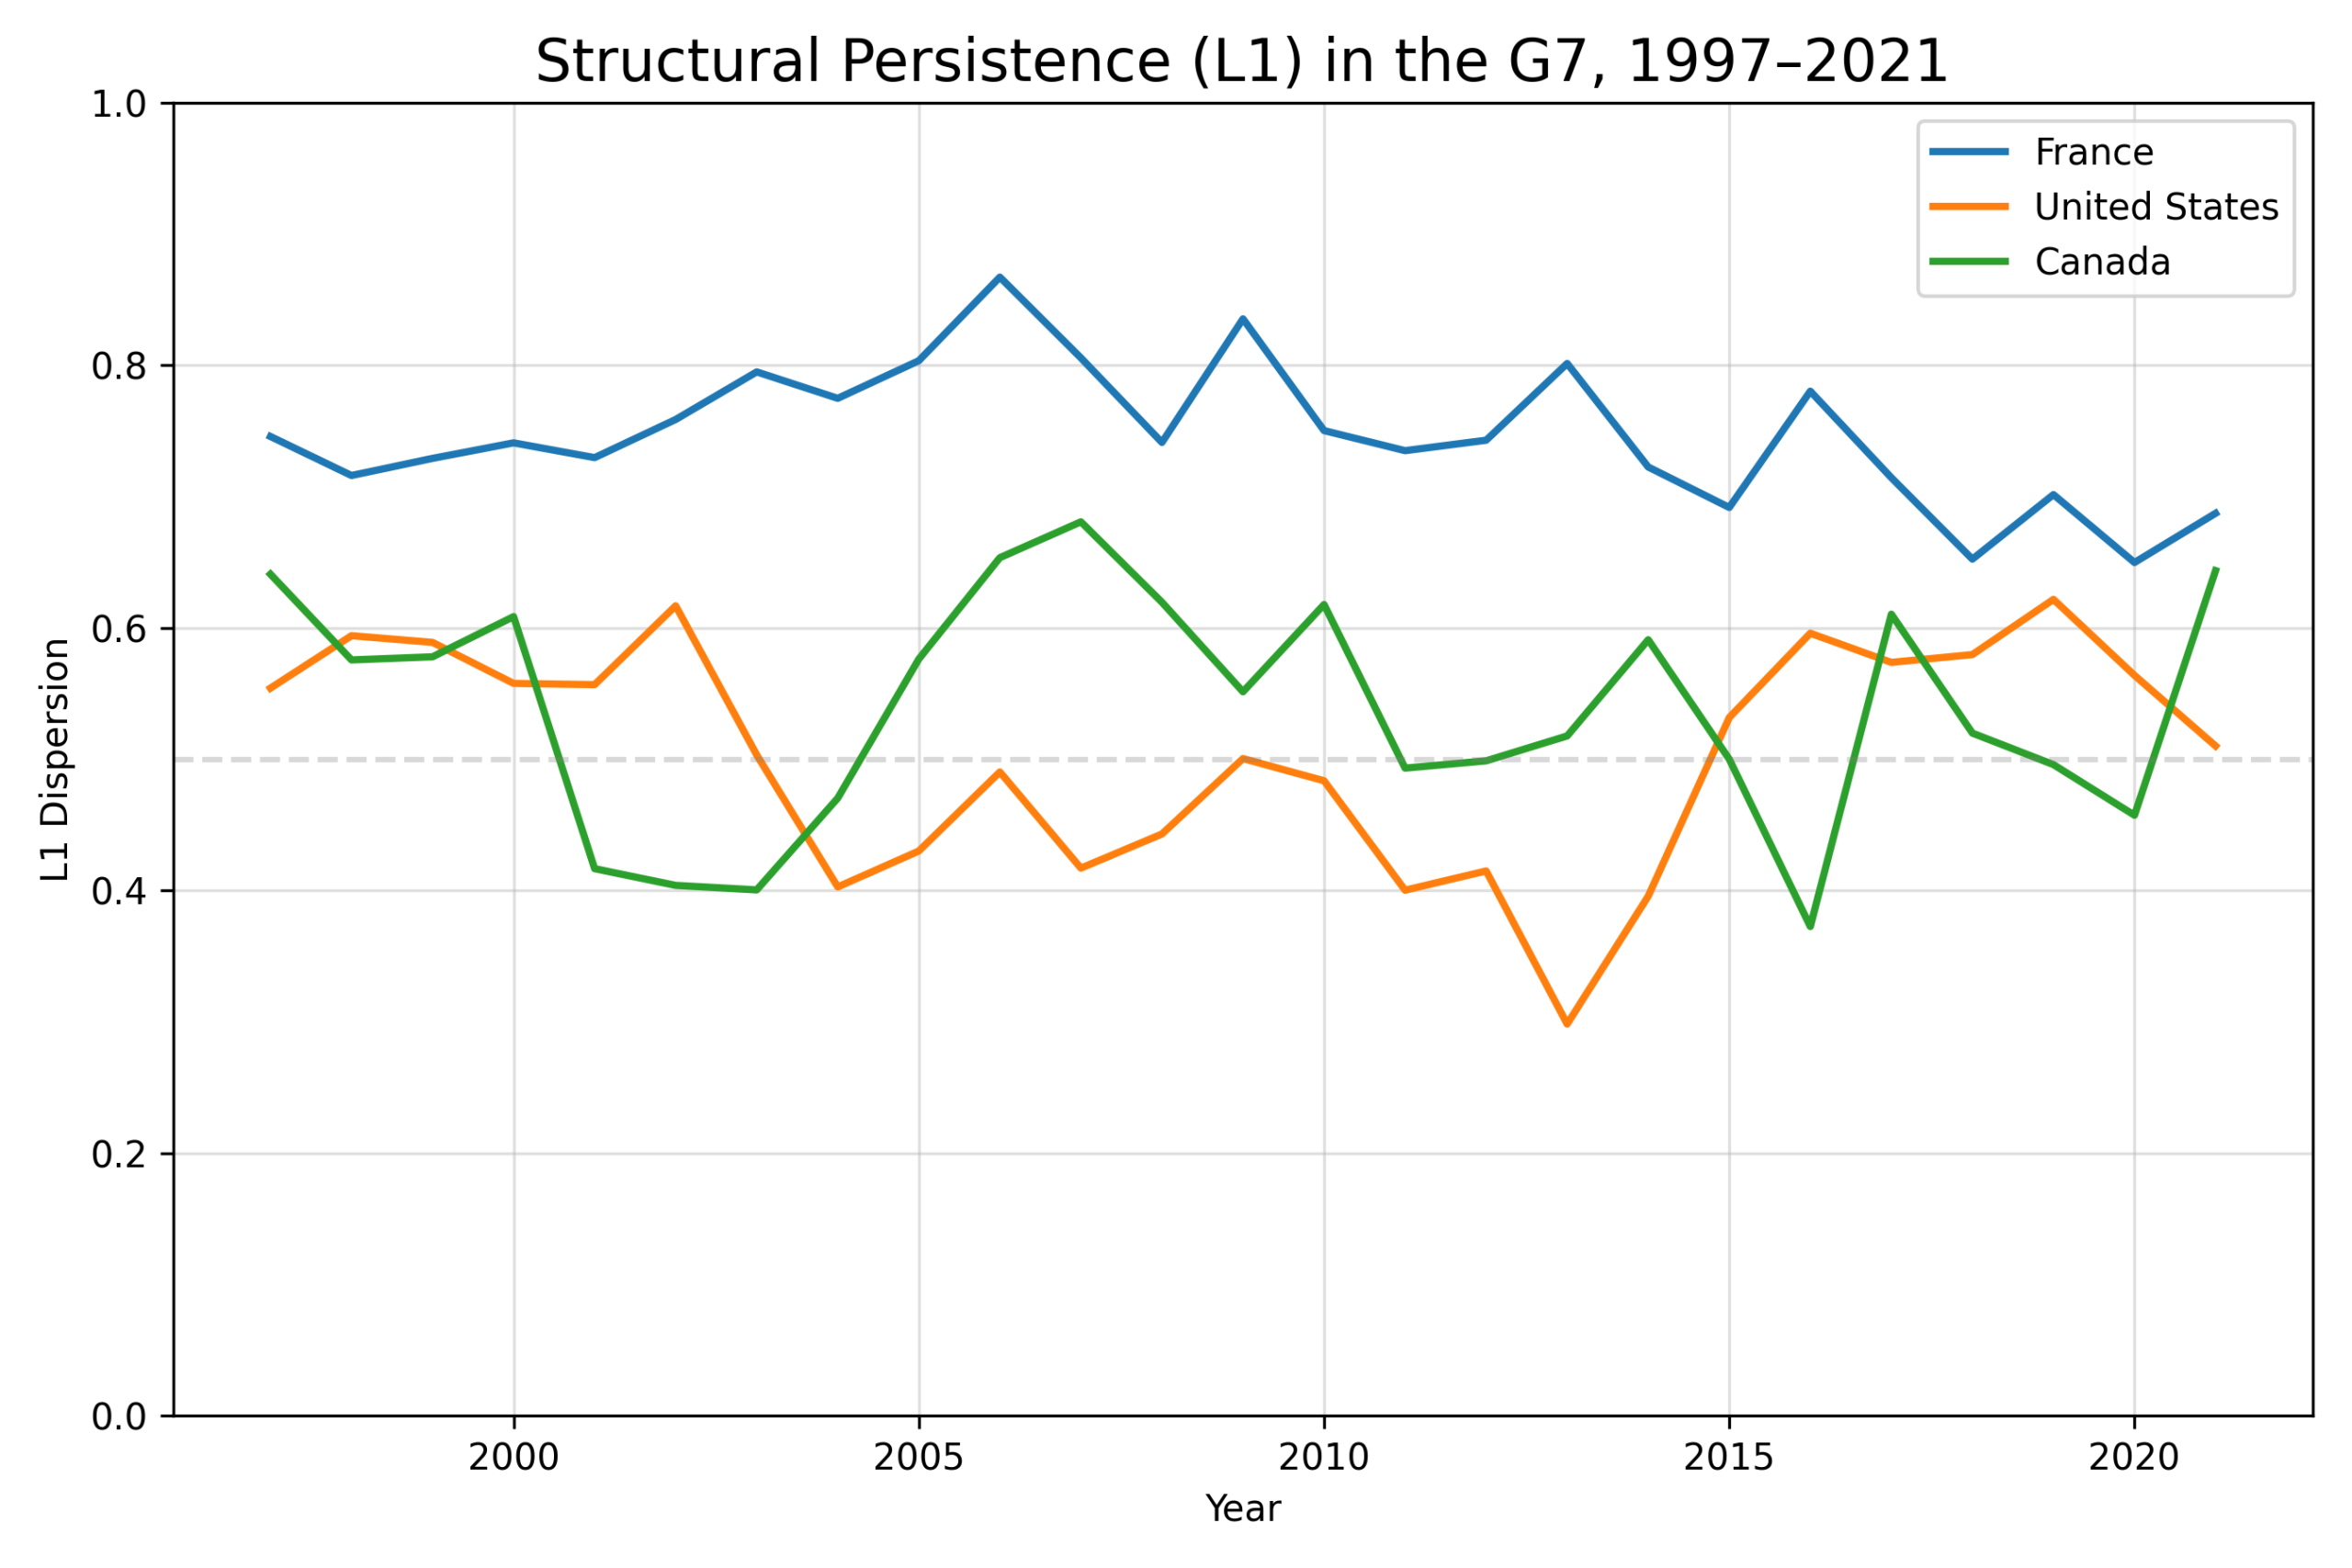
Figure 2. Structural persistence in the G7, 1997–2021. France, the United States, and Canada remain within a middle band of dispersion, showing limited long-run compression or divergence.
Source: World Bank, World Development Indicators (NV.AGR.TOTL.ZS, NV.IND.TOTL.ZS, NV.SRV.TOTL.ZS, SL.AGR.EMPL.ZS, SL.IND.EMPL.ZS, SL.SRV.EMPL.ZS).
France, the United States, and Canada all remain within a relatively stable range. Their internal productivity gaps do not collapse, but neither do they expand dramatically. This suggests a more inertial form of adjustment: structural imbalance is present, but its overall scale changes only slowly.
5. Divergence
In contrast, economies such as Japan and Italy show widening structural dispersion over time. Instead of compressing sectoral productivity gaps, these economies exhibit increasing structural imbalance.
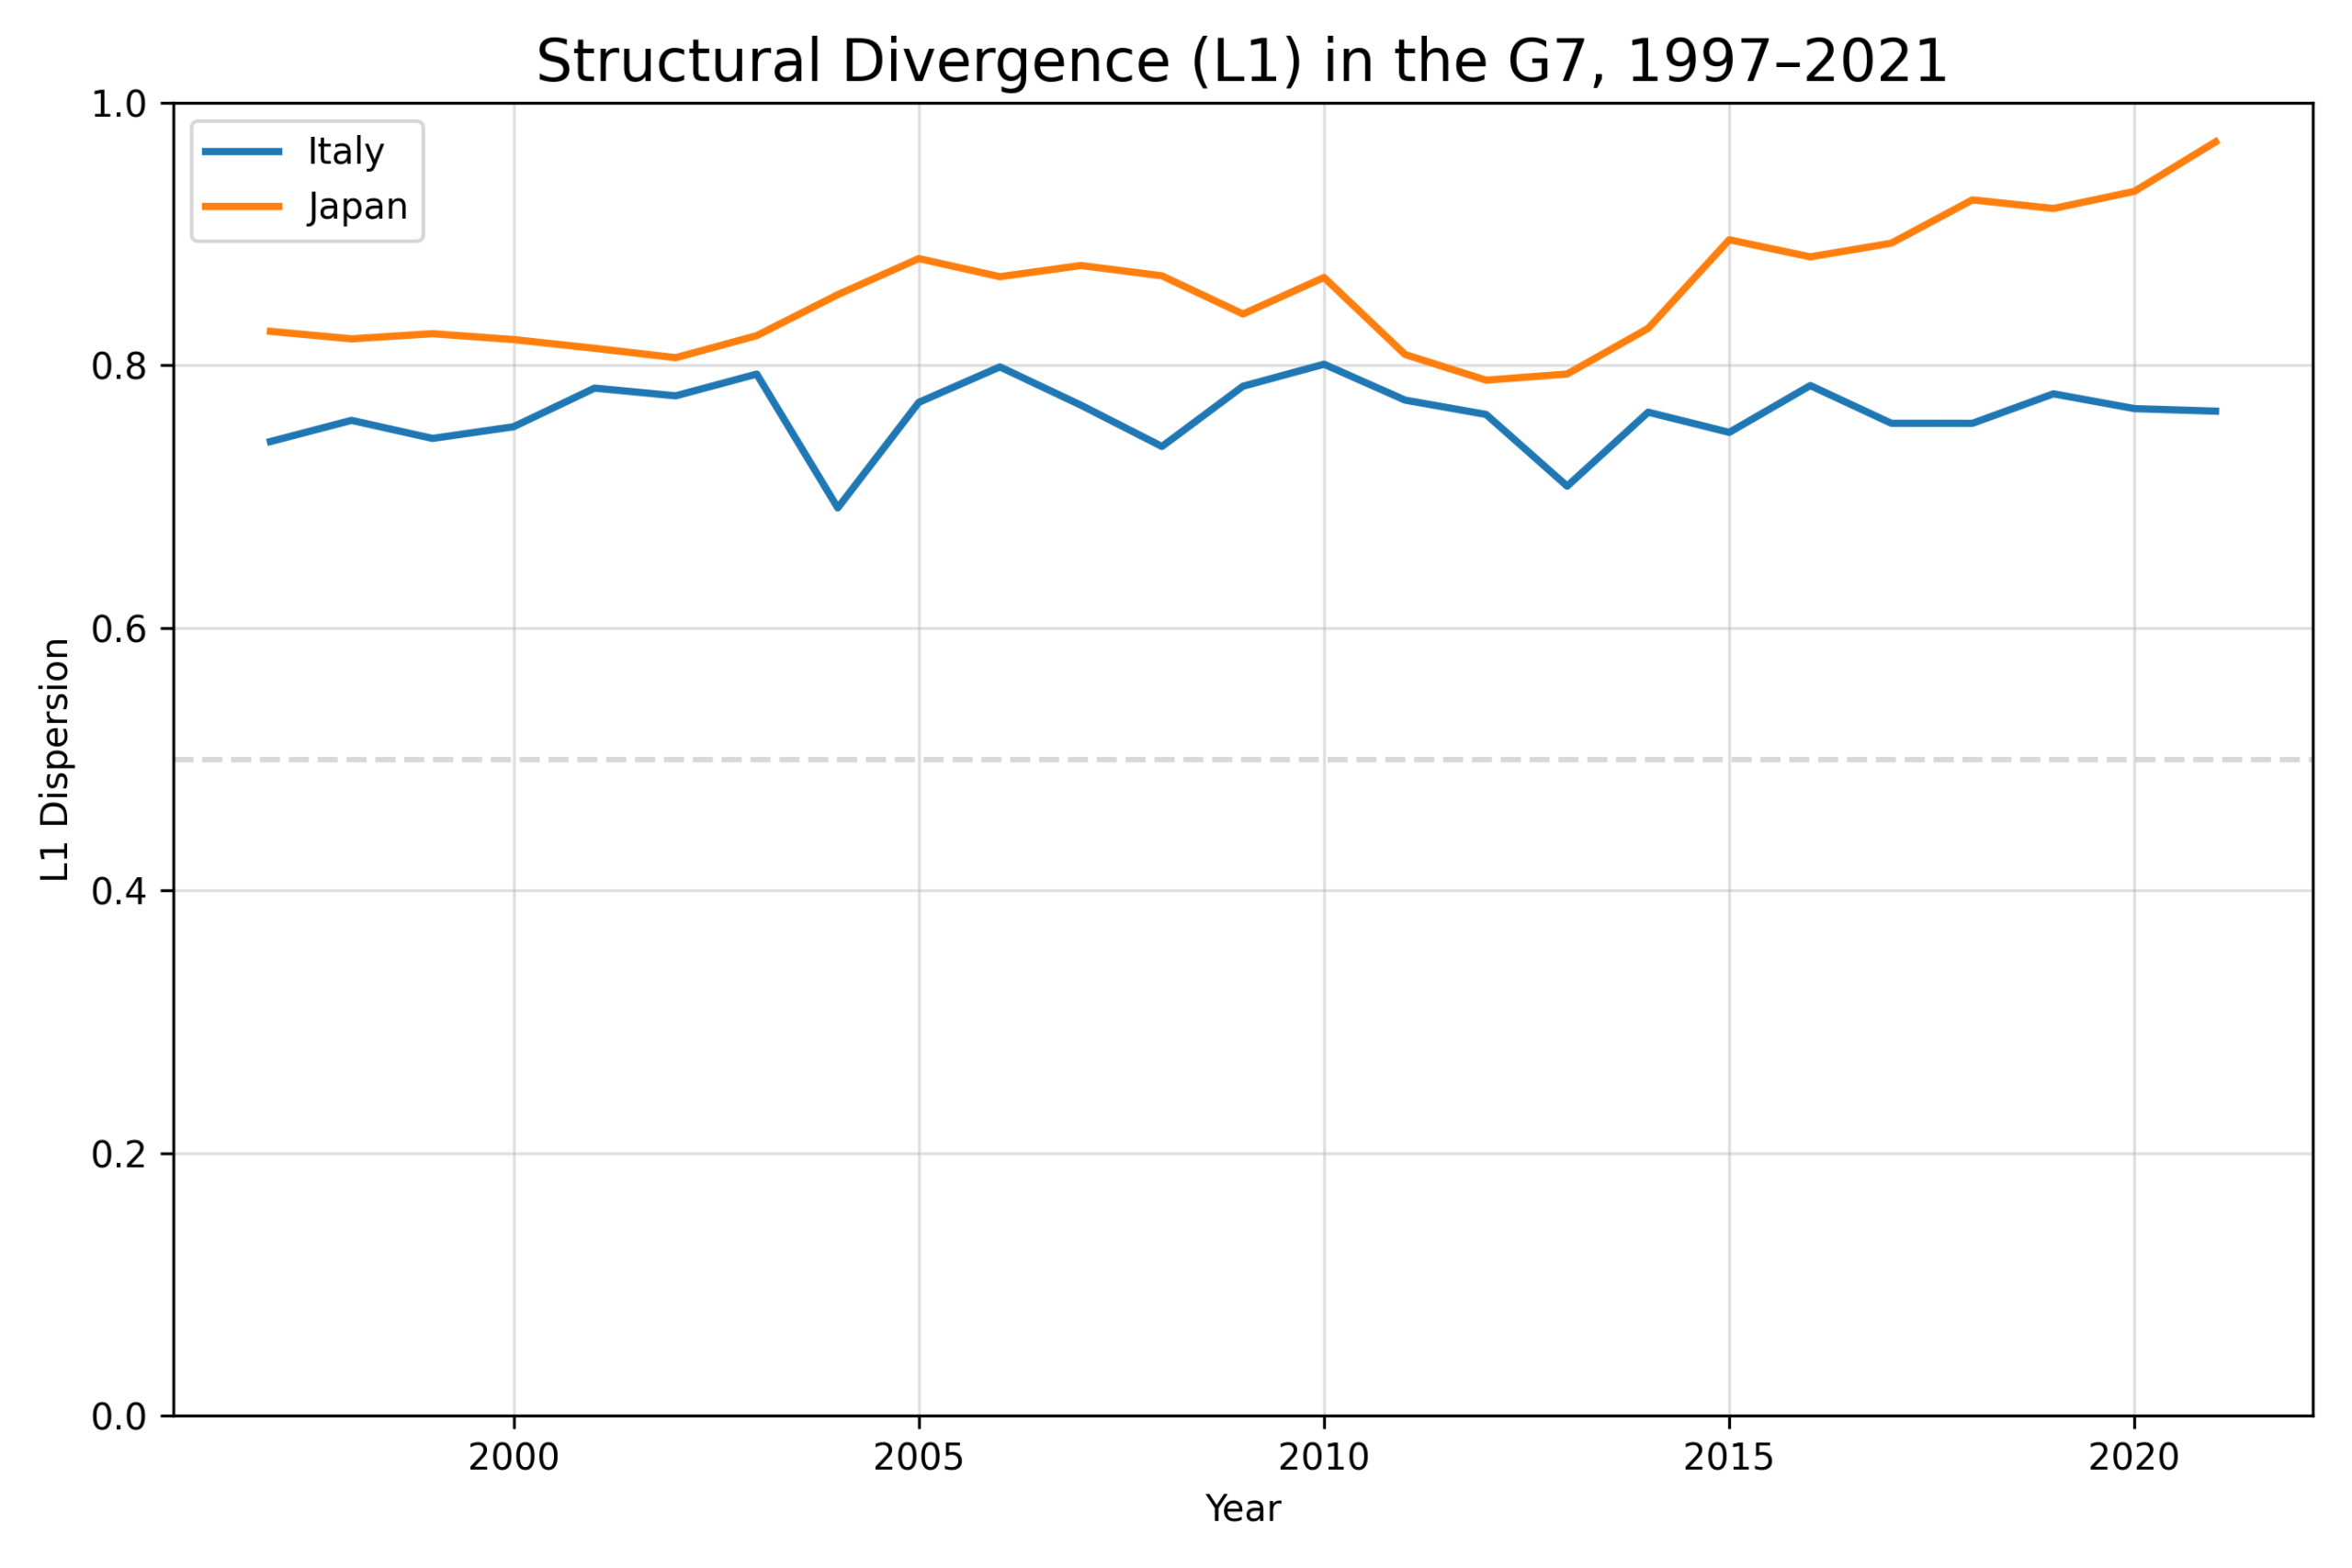
Figure 3. Structural divergence in the G7, 1997–2021. Italy remains broadly flat at a relatively high level, while Japan shows a clear upward drift, ending the period with the highest L1 dispersion in the G7.
Source: World Bank, World Development Indicators (NV.AGR.TOTL.ZS, NV.IND.TOTL.ZS, NV.SRV.TOTL.ZS, SL.AGR.EMPL.ZS, SL.IND.EMPL.ZS, SL.SRV.EMPL.ZS).
Japan provides the clearest example of divergence. Its L1 dispersion rises over the period and reaches the highest level observed among the G7 in 2021. Italy also remains structurally dispersed, though with a flatter path. In both cases, the central point is that sectoral productivity gaps do not naturally shrink with time.
6. A Compact Summary
The difference between these structural paths becomes clearer when we compare the first and last years of the period directly.
ΔL1 denotes the change in L1 dispersion between 1997 and 2021 (L12021 − L11997).
| Country | L1 (1997) | L1 (2021) | ΔL1 | Interpretation |
|---|---|---|---|---|
| United Kingdom | 0.73 | 0.34 | −0.39 | Strong compression |
| Germany | 0.85 | 0.57 | −0.28 | Compression |
| France | 0.75 | 0.69 | −0.06 | Persistence |
| United States | 0.55 | 0.51 | −0.04 | Persistence |
| Canada | 0.64 | 0.64 | +0.00 | Persistence |
| Italy | 0.74 | 0.77 | +0.02 | Mild divergence |
| Japan | 0.83 | 0.97 | +0.14 | Divergence |
Table 1. Change in L1 dispersion between 1997 and 2021. Negative values indicate compression of sectoral productivity gaps, while positive values indicate widening structural dispersion.
Source: World Bank, World Development Indicators (NV.AGR.TOTL.ZS, NV.IND.TOTL.ZS, NV.SRV.TOTL.ZS, SL.AGR.EMPL.ZS, SL.IND.EMPL.ZS, SL.SRV.EMPL.ZS).
7. What This Means
The main lesson is simple but important. Structural imbalance does not evolve in the same way across advanced economies. Some systems compress productivity gaps over time. Others retain them. Some even become more dispersed.
This means that structural misalignment is not merely a temporary imperfection. It can become a stable feature of an economy — or a worsening one. The fact that advanced economies follow such different paths suggests that internal adjustment is neither automatic nor uniform.
The G7 does not share one common structural trajectory. Some economies compress productivity gaps, others persist with them, and others diverge further. Structural adjustment is therefore an empirical question, not an automatic outcome.
8. Looking Ahead
Once this difference is visible, a deeper question emerges. Why do some economies narrow sectoral productivity gaps while others remain structurally divided? Why do some systems adjust, while others remain locked into persistent dispersion?
The next step is therefore not to measure structure again, but to examine the mechanisms that shape adjustment. Labor mobility, capital reallocation, firm dynamics, and institutional structure all become relevant once the empirical pattern is established.
This is where the discussion pages begin. They do not replace the structural evidence shown here. They attempt to explain why these divergent structural paths emerge.
→ See DISCUSSION #010 — Structural Adjustment and Divergent Productivity Paths
9. A New Dimension
So far, we have examined how labor is structured across sectors and how that structure evolves over time.
But structure is only one side of the picture.
Even if labor is unevenly allocated, another question remains: how fully is that labor actually utilized?
The next episode introduces this new dimension. It shifts the focus from allocation to utilization — from where people work to whether they work at all.
→ See EPISODE #011 — How Fully Is Labor Utilized?
All tables and figures on this site are generated from publicly available macroeconomic datasets.