DISCUSSION #011 — How Age-Specific Participation Evolves Over Time
We have compared participation structures across the G7 at one point in time.
Now we ask how these age-specific participation patterns evolve over time,
and which parts of the life cycle drive the changes.
Labor-force participation is often discussed as a single aggregate number.
But people do not enter and leave working life all at once.
Youth participation, prime-age participation, and older-age participation may each follow different structural paths.
Age-specific participation does not evolve as one unified process.
Across the G7, youth participation shows persistent cross-country separation,
prime-age participation remains relatively compressed and stable,
while older-age participation rises broadly over time.
Youth = ages 15–24;
Prime-age = ages 25–54;
Older-age = ages 55–64.
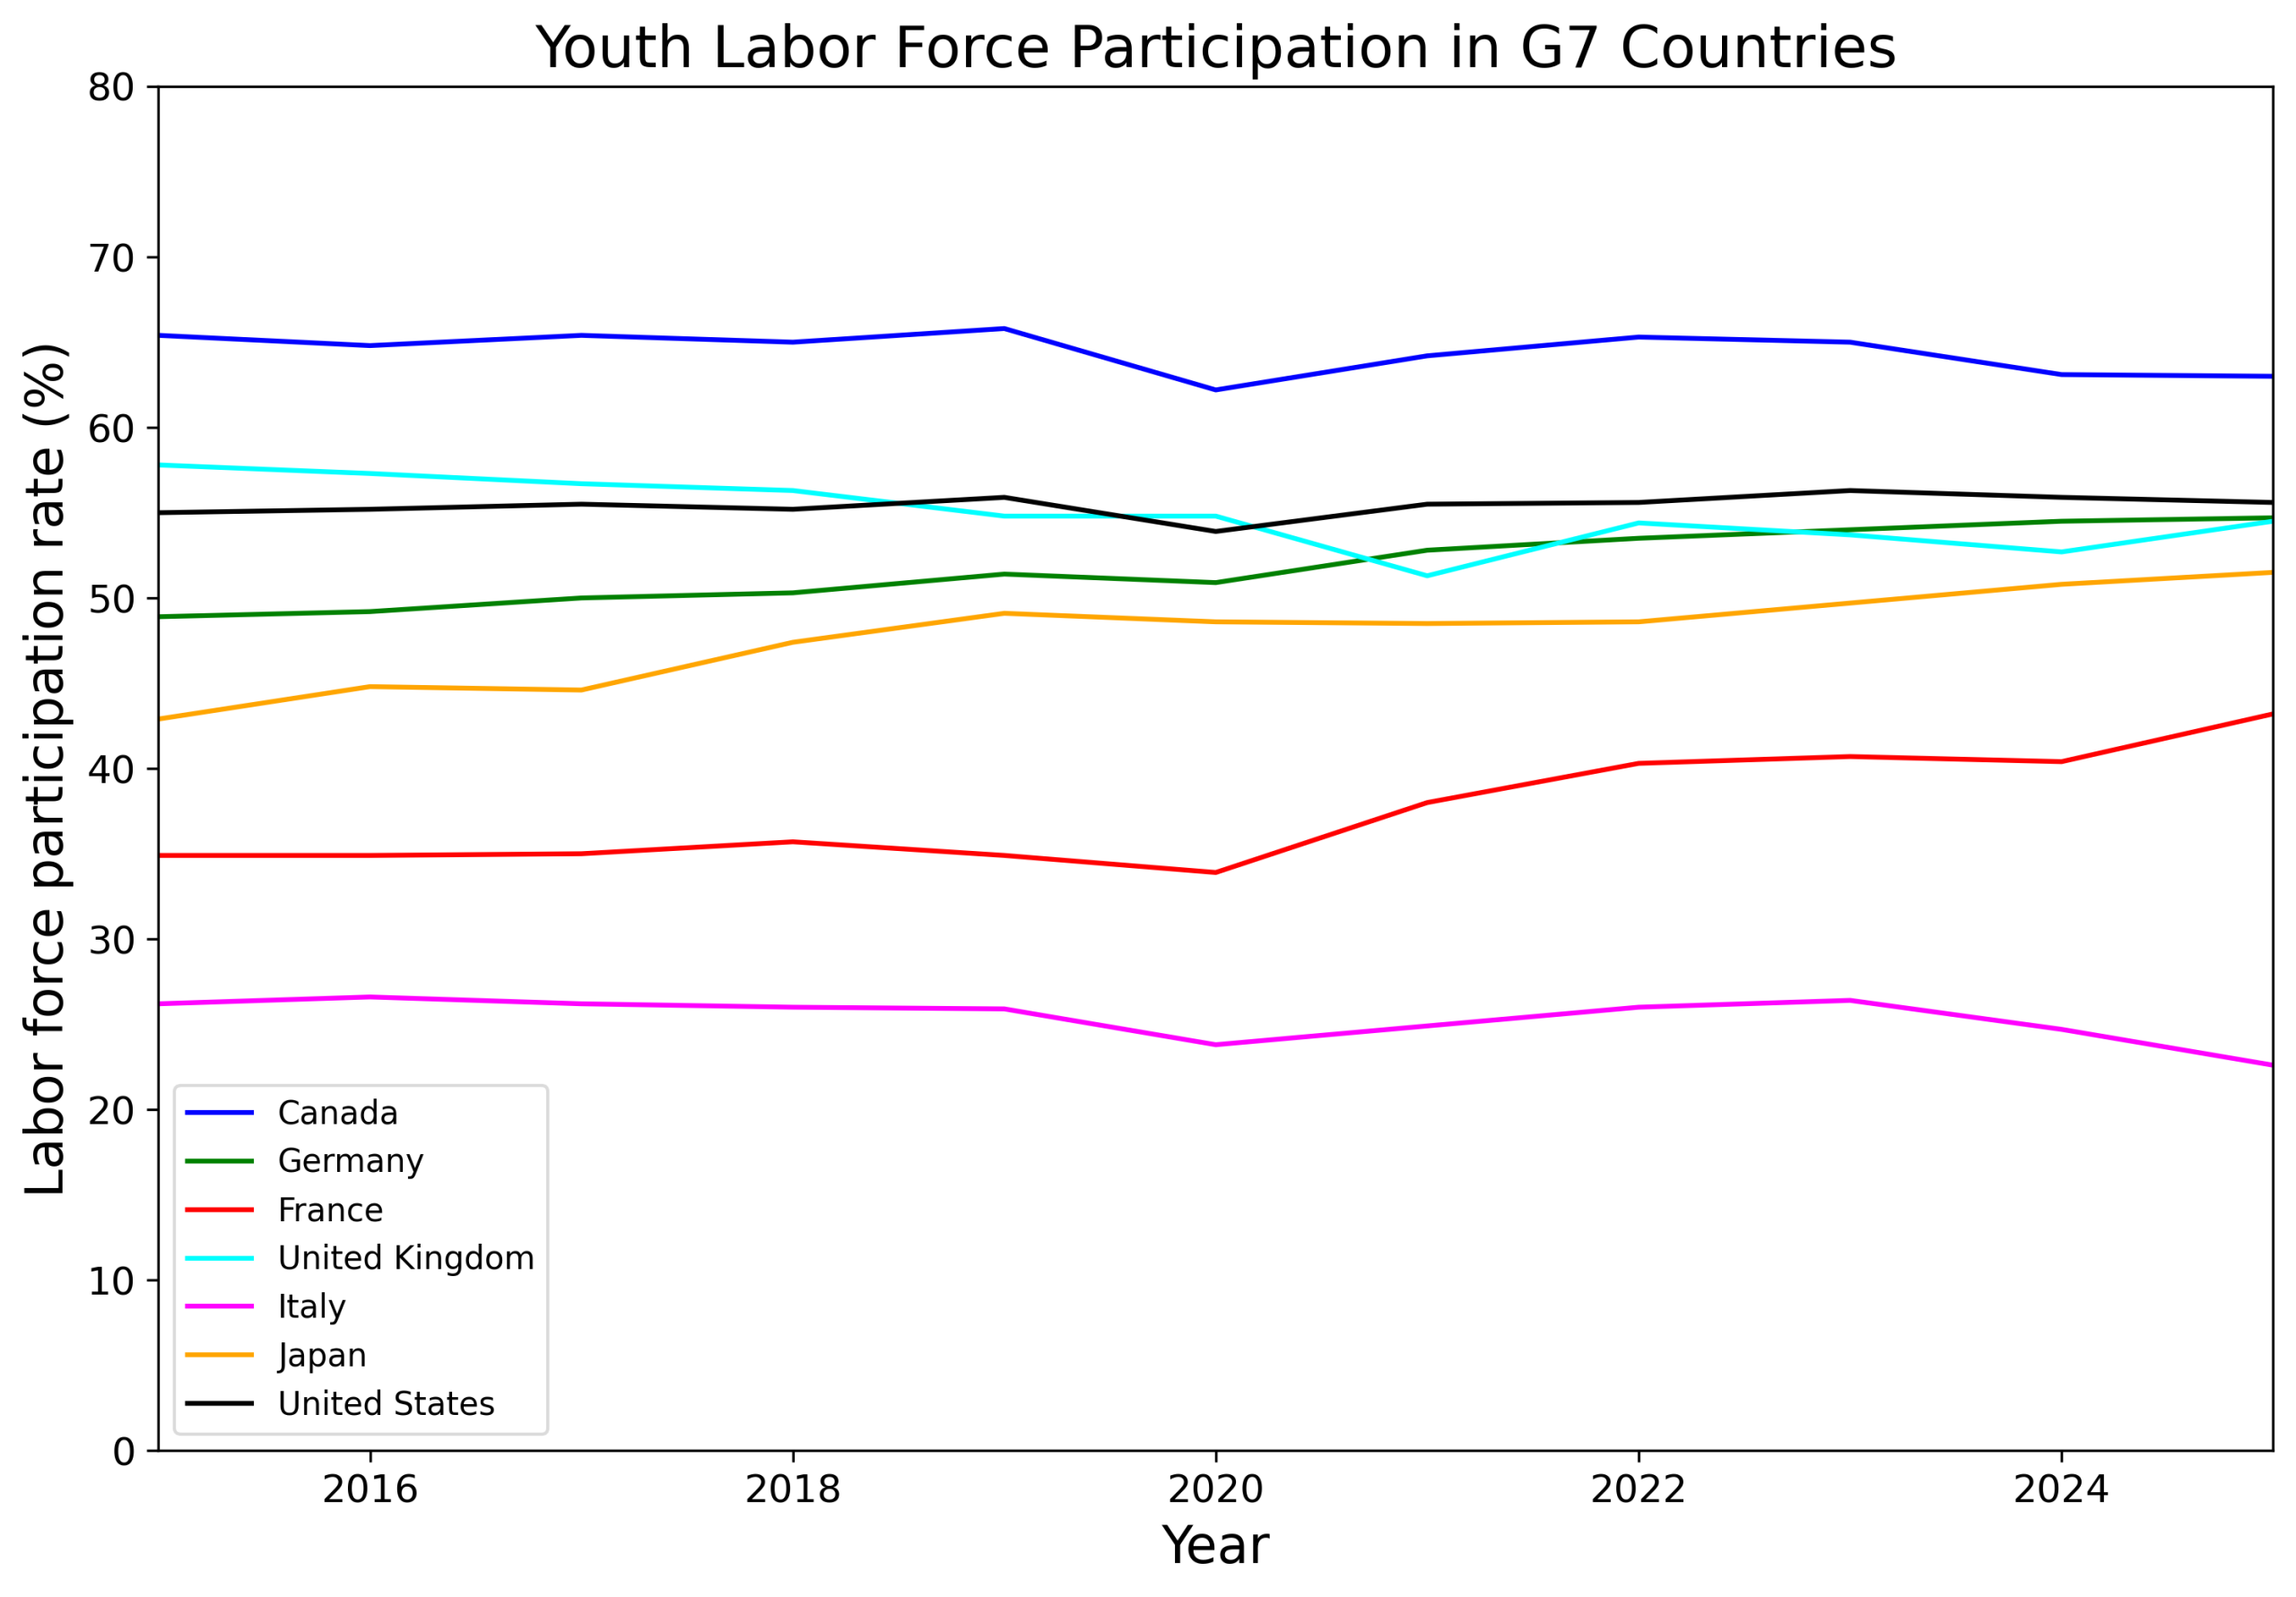
1. Youth Participation: Persistent Structural Separation
The first figure shows youth labor-force participation in the G7.
The most striking feature is not a short-term fluctuation, but a persistent cross-country separation.
Canada remains at a high level throughout the period, while Italy remains much lower.
This contrast is especially important because it appears to be structural rather than temporary.
Among advanced economies, young people are not connected to the labor market in the same way.
The figure does not explain why this difference exists.
Instead, it raises the question.
Youth participation may reflect differences in education systems, school-to-work transitions,
part-time employment, family expectations, labor-market institutions, or some combination of these.
This is why the Canada–Italy contrast is so useful analytically.
It does not invite a quick ranking of countries.
It invites a structural question:
why do young people appear so differently attached to the labor market across advanced economies?
2. Prime-age Participation: The Stable Core
The second figure shows prime-age labor-force participation.
Compared with youth participation, the lines are much more compressed.
The countries differ, but the overall range is narrower and the movement is calmer.
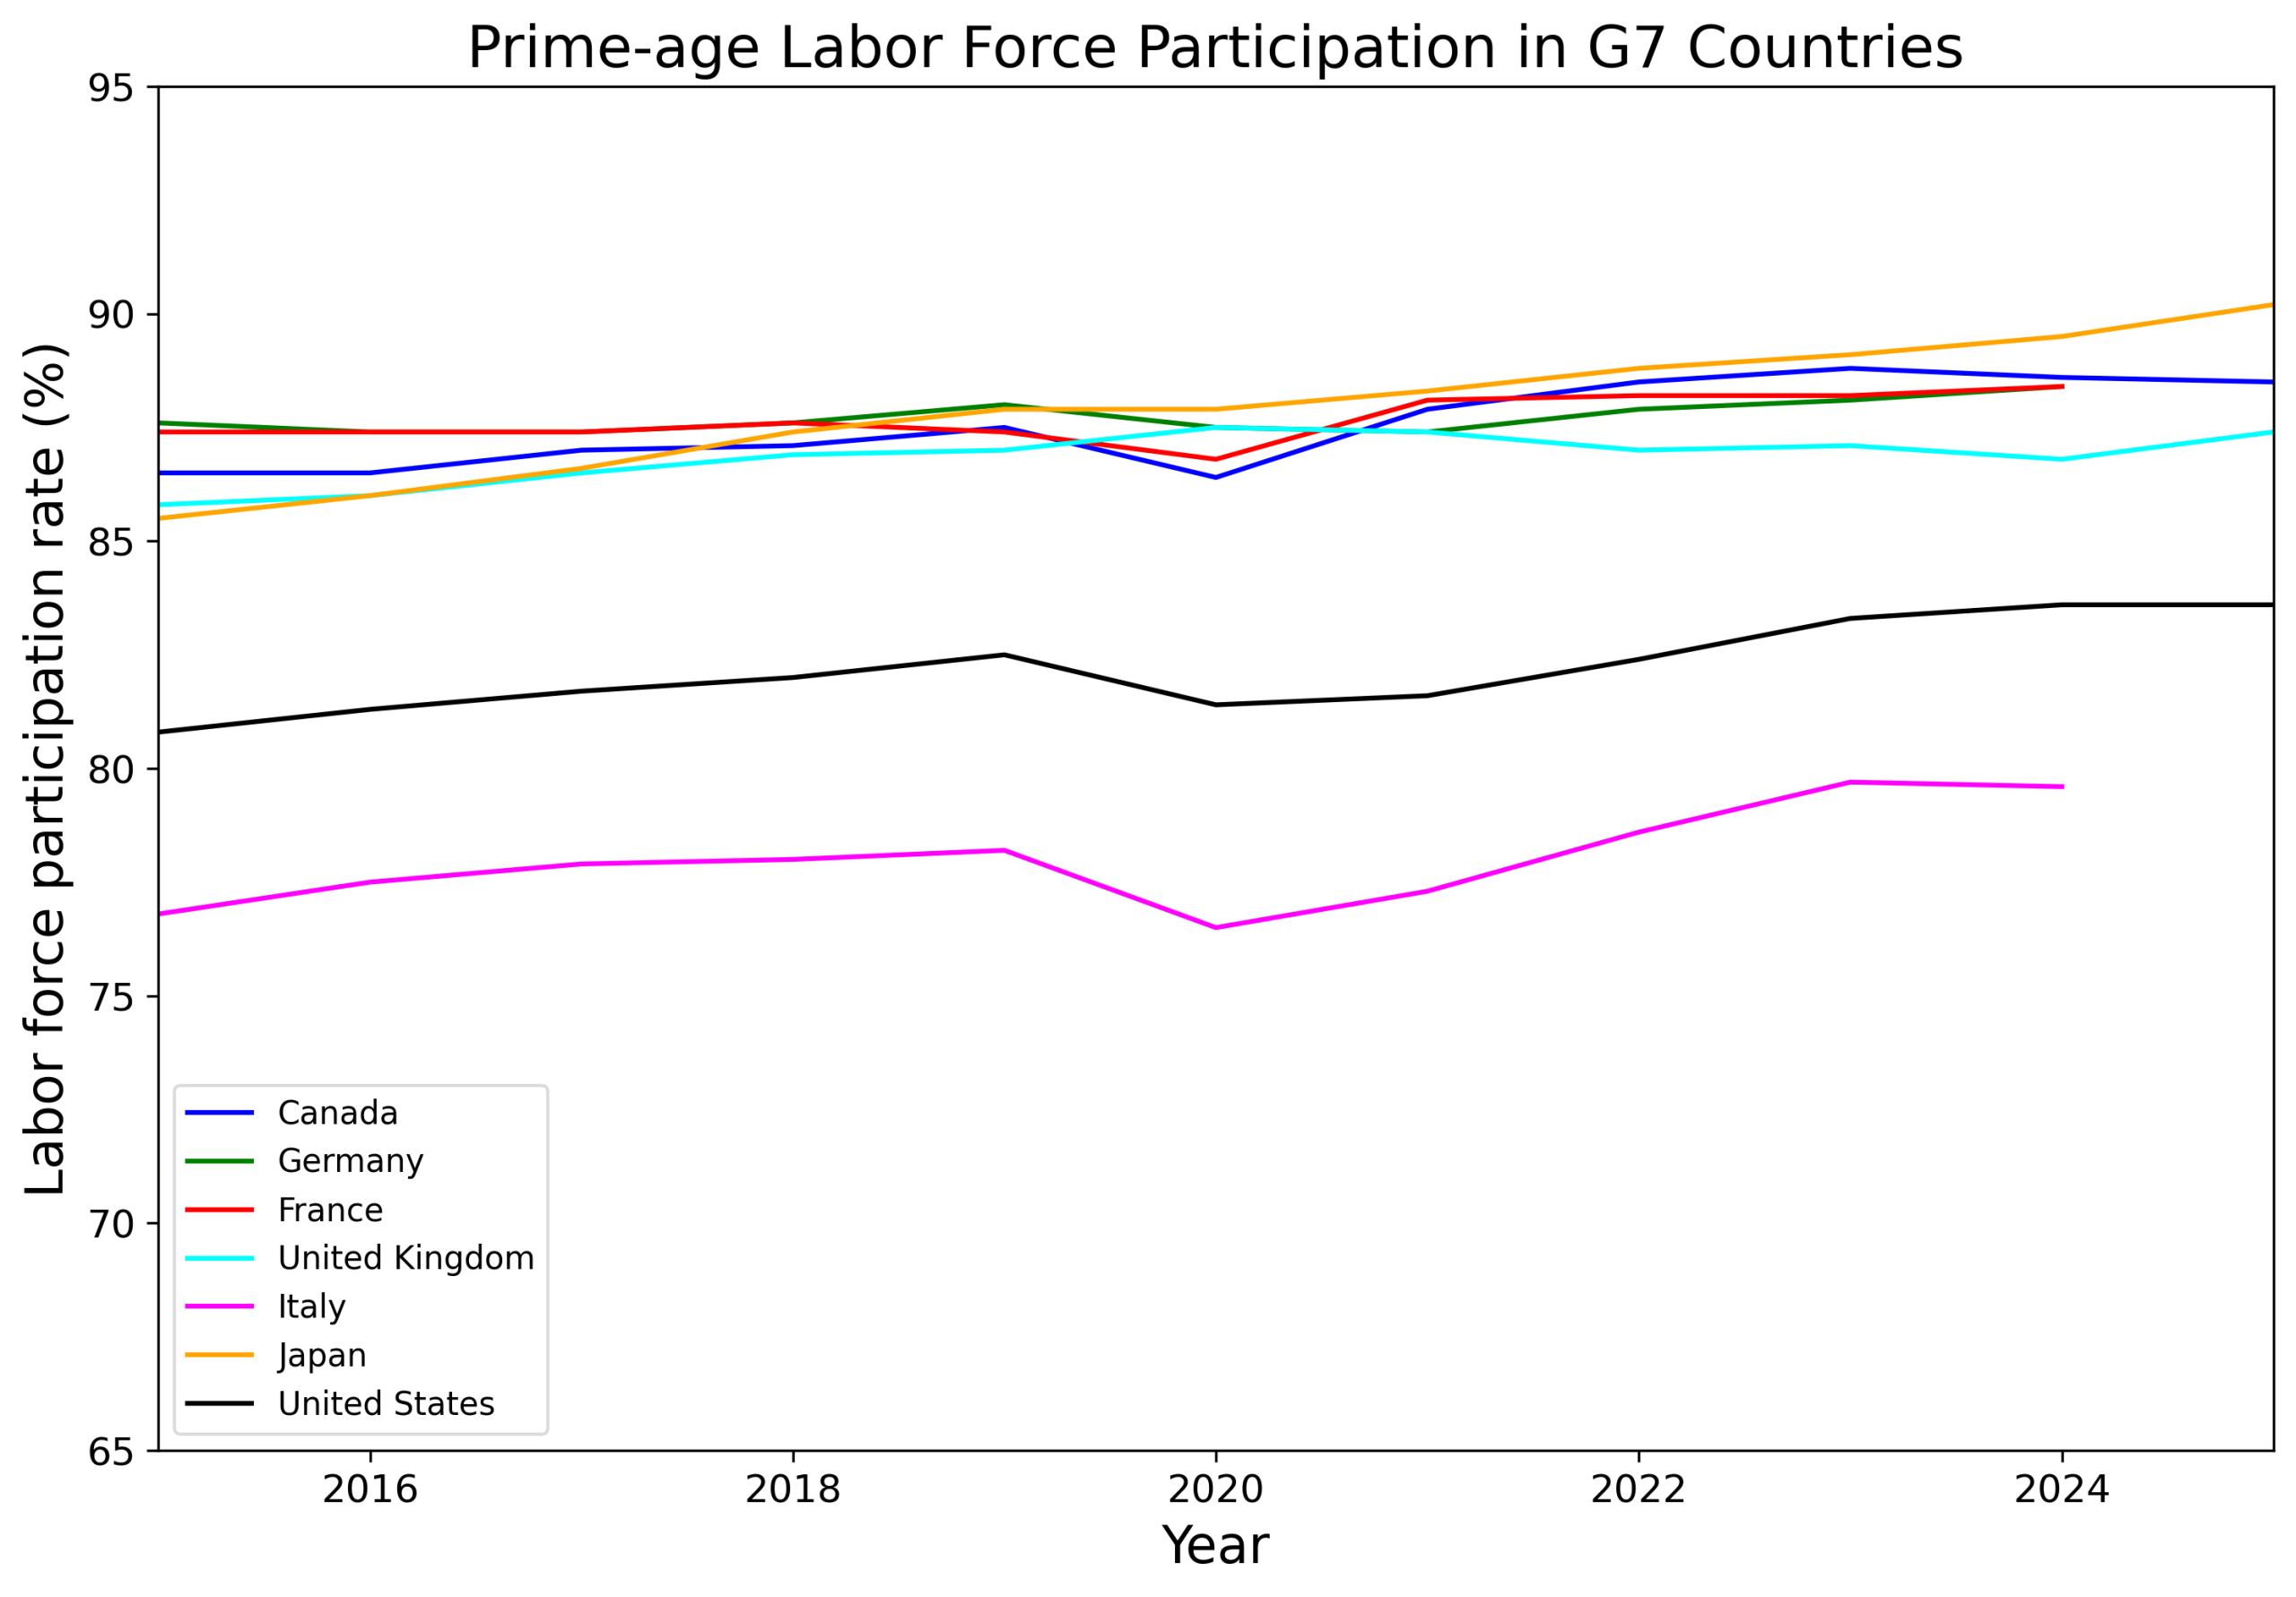
Source: ILOSTAT, labor-force participation rate by sex and age.
Note: 2025 data are unavailable for Italy, France, and Germany at the time of figure construction.
This stability is itself informative.
Prime-age participation appears to behave as the core of labor utilization.
Most people in this age range are already strongly attached to working life,
so cross-country differences are less dramatic than among the young or the older population.
In this sense, the prime-age figure acts as a reference point.
It shows that the largest visible differences in participation do not necessarily appear
in the middle of working life.
They appear more strongly near the boundaries of working life:
entry into work and exit from work.
3. Older-age Participation: The Expansion of Late-career Work
The third figure shows older-age labor-force participation.
Here the dominant pattern is different again.
Across the G7, participation among older workers rises broadly over time.

This upward movement suggests a structural expansion of late-career work.
The figure is not mainly showing a temporary labor-market cycle.
It points to a longer transformation in how older people remain connected to employment.
Japan is especially visible in this figure.
Its older-age participation is high and continues to rise.
Other countries also show upward movement, but the level and timing differ.
The general tendency is therefore common, while each country retains its own structural position.
4. What the Three Figures Reveal Together
When the three figures are placed side by side conceptually, a simple but important pattern emerges.
Labor-force participation is not one uniform phenomenon.
It evolves differently depending on where people are in the life cycle.
| Age group | Visible pattern | Structural interpretation |
|---|---|---|
| Youth | Persistent cross-country separation | Differences in labor-market entry and school-to-work transition |
| Prime-age | Relative stability and compression | Core working-age attachment to the labor market |
| Older-age | Broad upward movement | Expansion of late-career labor-force participation |
The youth figure reveals strong structural separation.
The prime-age figure reveals a more stable core.
The older-age figure reveals a broad upward transformation.
Together, they show that participation changes are distributed unevenly across the life cycle.
This matters because an aggregate participation rate can hide very different underlying movements.
A country may experience stable prime-age participation while youth participation diverges
or older-age participation expands.
Without separating the life cycle, these differences remain difficult to see.
The life cycle matters.
Youth participation reveals persistent structural divergence,
prime-age participation reveals the stable core of labor-market attachment,
and older-age participation reveals the broad expansion of late-career work.
5. From Observation to the Next Question
The figures do not tell us whether the observed patterns are caused by institutions, culture,
demography, labor demand, education systems, or policy changes.
They show that such questions are worth asking.
For example, the large gap between Canada and Italy in youth participation naturally raises a deeper question:
is this difference mainly institutional, cultural, or a result of the interaction between institutions and social expectations?
The figure does not settle the issue.
It opens the inquiry.
This is the role of structural observation.
Before explaining differences, we first need to see them clearly.
The three figures help us see that the life cycle is not a neutral background.
It is part of the structure of labor utilization itself.
Unresolved Question
Age-specific participation rates evolve differently across the life cycle.
But aggregate participation is also shaped by the population structure.
If the share of older people rises, then older-age participation may matter more for the whole economy,
even if the participation rate within that group changes only gradually.
This leads to the next question:
how do demographic composition and age-specific participation jointly shape aggregate labor-force participation?